Note
Click here to download the full example code
The PlotDesign method
The goal of this example is to present the features of the PlotDesign static method.
Distribution
import openturns as ot
import openturns.viewer as otv
import pylab as pl
import openturns.viewer as viewer
from matplotlib import pylab as plt
ot.Log.Show(ot.Log.NONE)
In two dimensions
dim = 2
X = [ot.Uniform()] * dim
distribution = ot.ComposedDistribution(X)
sampleSize = 10
sample = distribution.getSample(sampleSize)
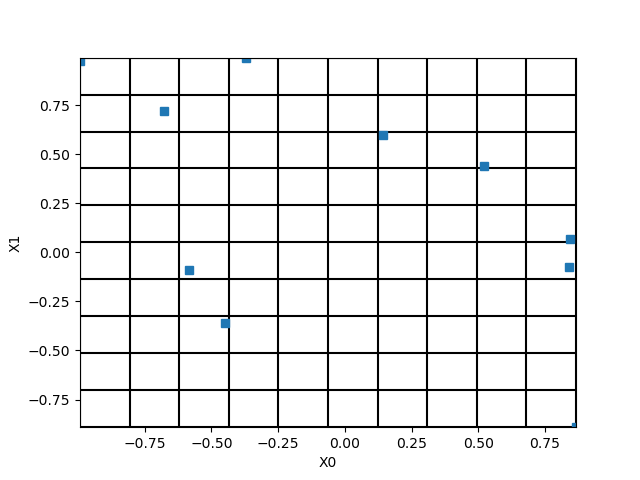
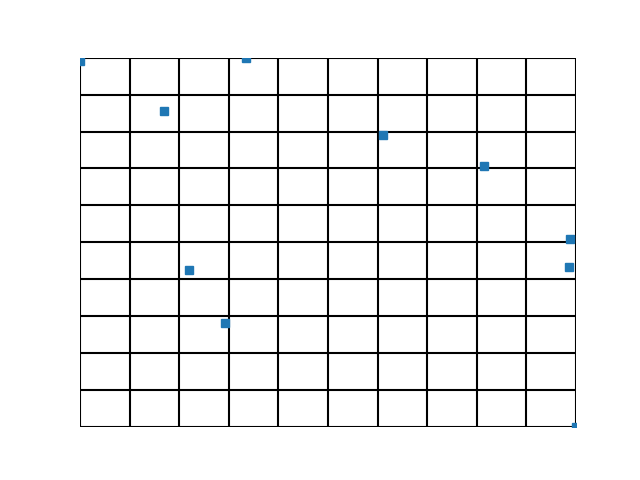
With default parameters the bounds are computed from the sample.
fig = otv.PlotDesign(sample);
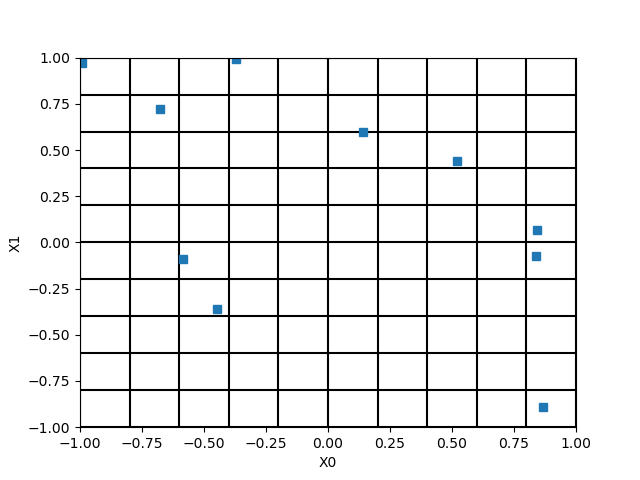
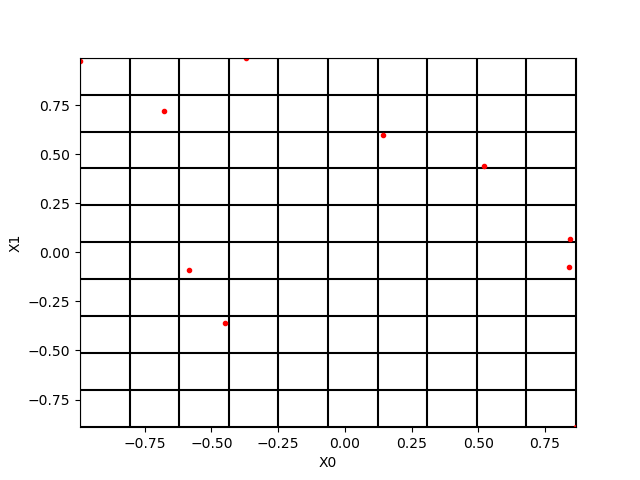
Set the bounds.
bounds = distribution.getRange()
fig = otv.PlotDesign(sample, bounds);
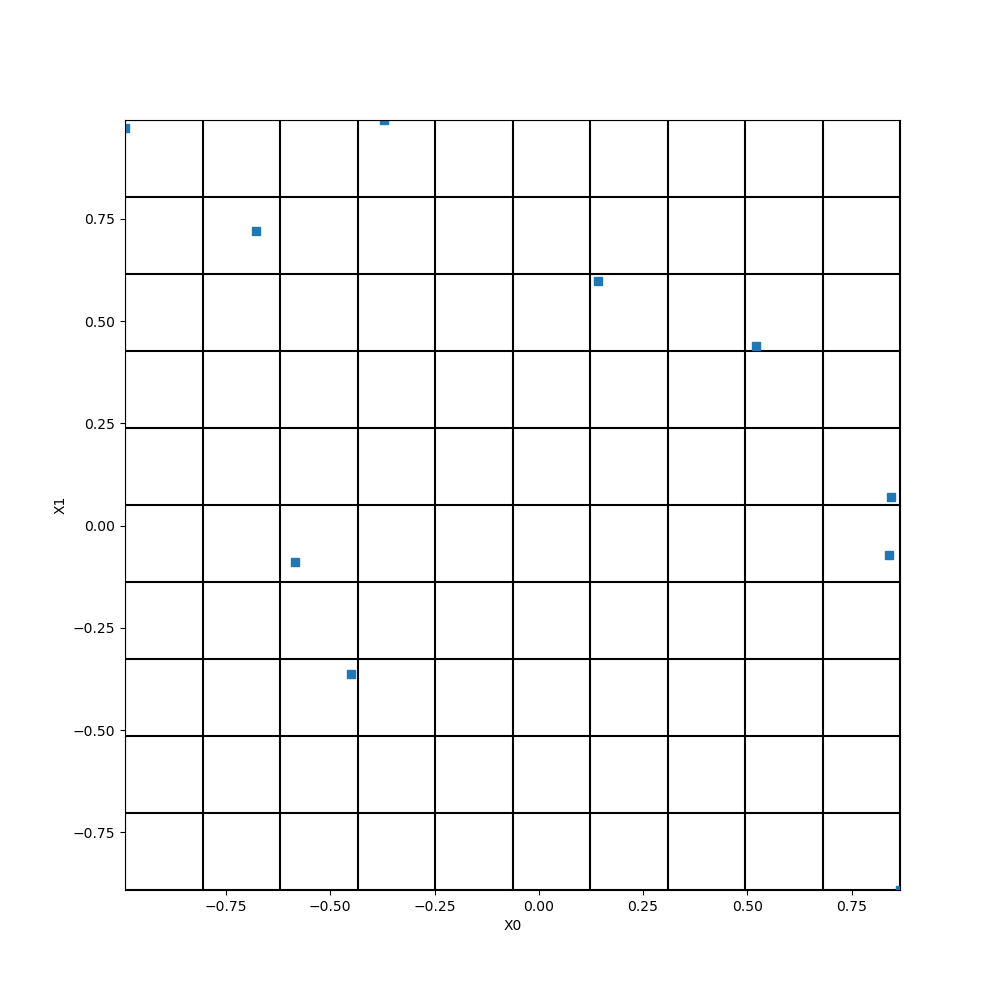
Configure the size of the plot.
fig = otv.PlotDesign(sample)
fig.set_size_inches(10, 10)
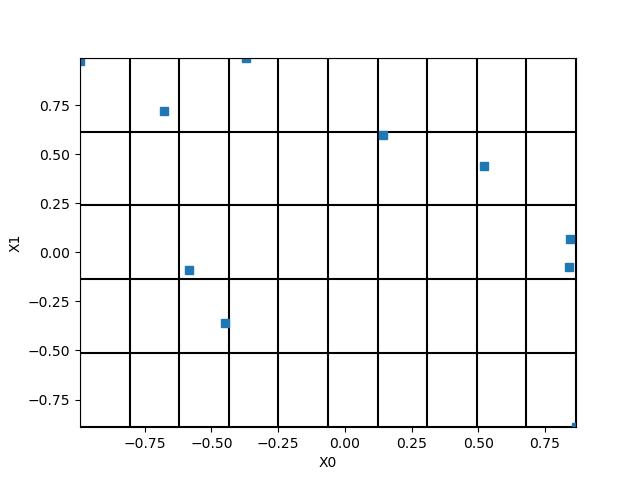
Configure the number of subdivisions in each direction.
fig = otv.PlotDesign(sample, subdivisions = [10, 5]);
Disable the ticks.
fig = otv.PlotDesign(sample, enableTicks = False);
Configure the marker.
fig = otv.PlotDesign(sample, plot_kw =
               {"marker":'.', "color": "red"});
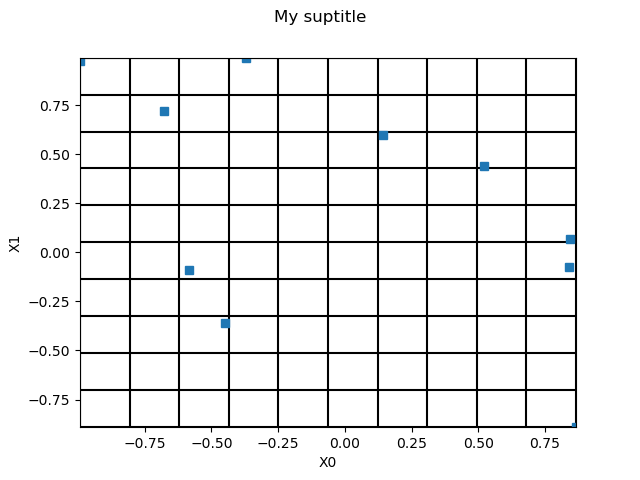
Create the figure beforehand.
import matplotlib.pyplot as plt
fig = plt.figure()
fig.suptitle("My suptitle")
fig = otv.PlotDesign(sample, figure = fig);
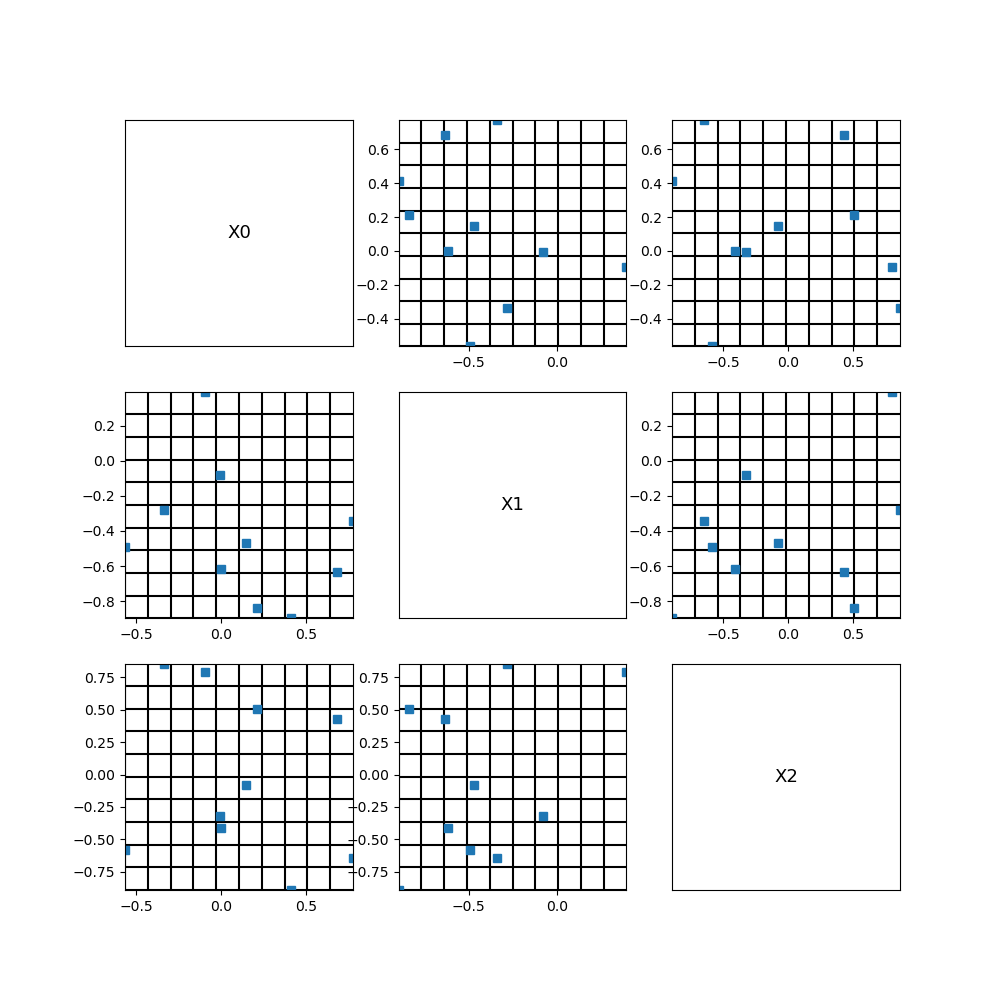
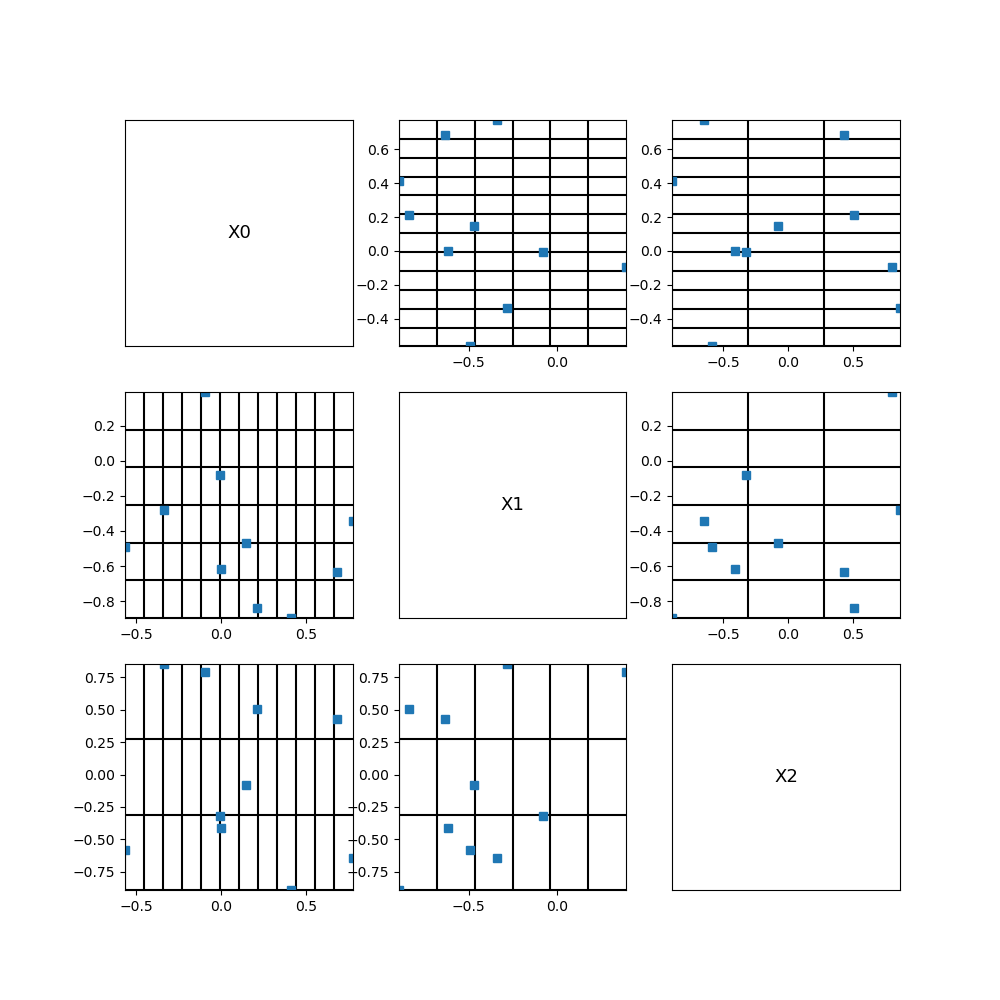
In three dimensions
dim = 3
X = [ot.Uniform()] * dim
distribution = ot.ComposedDistribution(X)
sampleSize = 10
sample = distribution.getSample(sampleSize)
fig = otv.PlotDesign(sample);
fig.set_size_inches(10, 10)
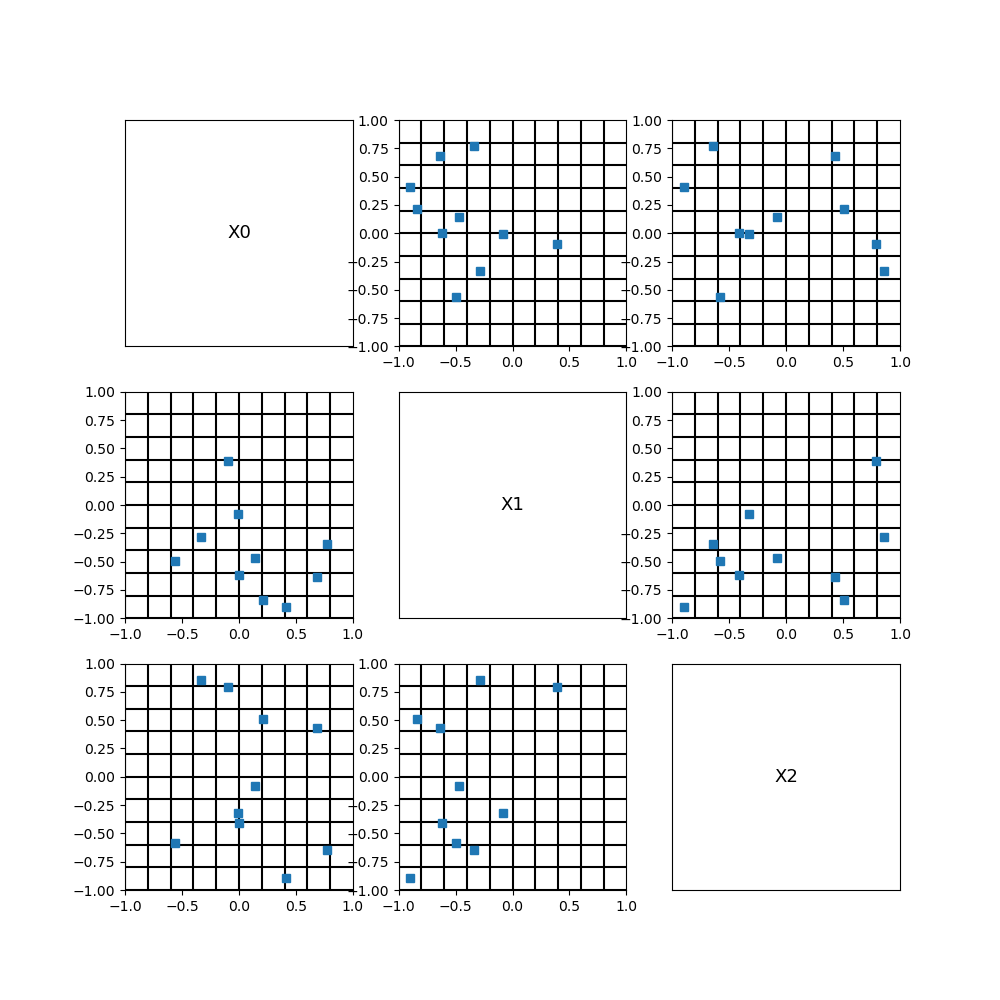
Configure the number of subdivisions.
fig = otv.PlotDesign(sample, subdivisions = [12, 6, 3]);
fig.set_size_inches(10, 10)
Configure the bounds.
bounds = distribution.getRange()
fig = otv.PlotDesign(sample, bounds);
fig.set_size_inches(10, 10)
Total running time of the script: ( 0 minutes 1.536 seconds)