DrawKendallPlot
(Source code, png, hires.png, pdf)

- DrawKendallPlot(*args)
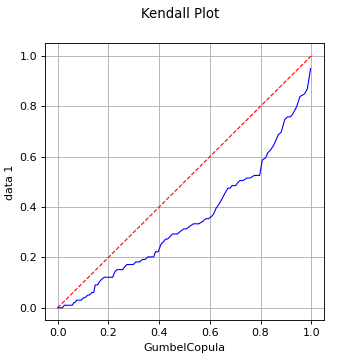
Draw kendall plot.
Refer to Graphical goodness-of-fit tests.
- Available usages:
VisualTest.DrawKendallPlot(sample, distribution)
VisualTest.DrawKendallPlot(sample, sample2)
- Parameters
- sample, sample22-d sequence of float
Samples to draw.
- distribution
Distribution Distribution used to plot the second cloud
- Returns
- graph
Graph The graph object
- graph
Examples
>>> import openturns as ot
>>> from openturns.viewer import View
>>> ot.RandomGenerator.SetSeed(0)
>>> size = 100
>>> copula1 = ot.FrankCopula(1.5)
>>> copula2 = ot.GumbelCopula(4.5)
>>> sample1 = copula1.getSample(size)
>>> sample1.setName('data 1')
>>> sample2 = copula2.getSample(size)
>>> sample2.setName('data 2')
>>> kendallPlot1 = ot.VisualTest.DrawKendallPlot(sample1, copula2)
>>> View(kendallPlot1).show()