Note
Go to the end to download the full example code
Optimization of the Rastrigin test function
The Rastrigin function is defined by:
where and
.
It has a global minimum at where
.
This function has many local minima, so optimization algorithms must be run from multiple starting points.
In our example, we consider the bidimensional case, i.e. .
References:
Rastrigin, L. A. “Systems of extremal control.” Mir, Moscow (1974).
Rudolph, G. “Globale Optimierung mit parallelen Evolutionsstrategien”. Diplomarbeit. Department of Computer Science, University of Dortmund, July 1990.
Definition of the problem
import openturns as ot
import openturns.viewer as viewer
import numpy as np

ot.Log.Show(ot.Log.NONE)


def rastriginPy(X):
    A = 10.0
    delta = [x**2 - A * np.cos(2 * np.pi * x) for x in X]
    y = A + sum(delta)
    return [y]


dim = 2
rastrigin = ot.PythonFunction(dim, 1, rastriginPy)
print(rastrigin([1.0, 1.0]))
[-8]
Making rastrigin into a MemoizeFunction will make it recall all evaluated points.
rastrigin = ot.MemoizeFunction(rastrigin)
This example is academic and the point achieving the global minimum of the function is known.
xexact = [0.0] * dim
print(xexact)
[0.0, 0.0]
The optimization bounds must be specified.
lowerbound = [-4.4] * dim
upperbound = [5.12] * dim
bounds = ot.Interval(lowerbound, upperbound)
Plot the iso-values of the objective function
graph = rastrigin.draw(lowerbound, upperbound, [100] * dim)
graph.setTitle("Rastrigin function")
view = viewer.View(graph, legend_kw={"bbox_to_anchor": (1, 1), "loc": "upper left"})
view.getFigure().tight_layout()
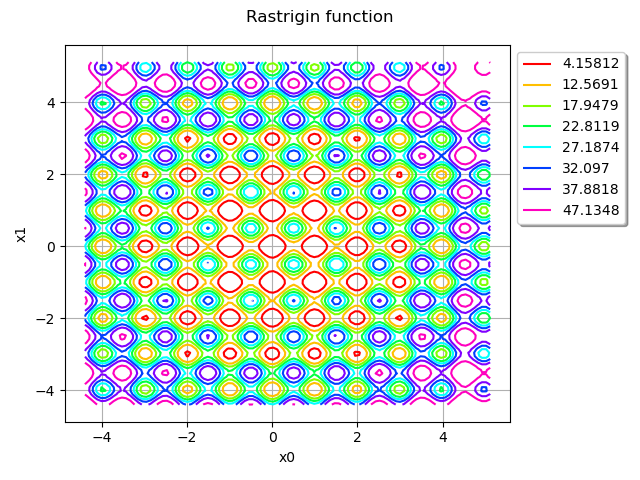
We see that the Rastrigin function has several local minima. However, there is only one single global minimum at .
Create the problem and set the optimization algorithm
problem = ot.OptimizationProblem(rastrigin)
We use the Cobyla algorithm and run it from multiple starting points selected by a LowDiscrepancyExperiment.
size = 64
distribution = ot.ComposedDistribution([ot.Uniform(lowerbound[0], upperbound[0])] * dim)
experiment = ot.LowDiscrepancyExperiment(ot.SobolSequence(), distribution, size)
solver = ot.MultiStart(ot.Cobyla(problem), experiment.generate())
Visualize the starting points of the optimization algorithm
startingPoints = solver.getStartingSample()
graph = rastrigin.draw(lowerbound, upperbound, [100] * dim)
graph.setTitle("Rastrigin function")
cloud = ot.Cloud(startingPoints)
cloud.setPointStyle("bullet")
cloud.setColor("black")
graph.add(cloud)
graph.setLegends([""])
# sphinx_gallery_thumbnail_number = 2
view = viewer.View(graph)
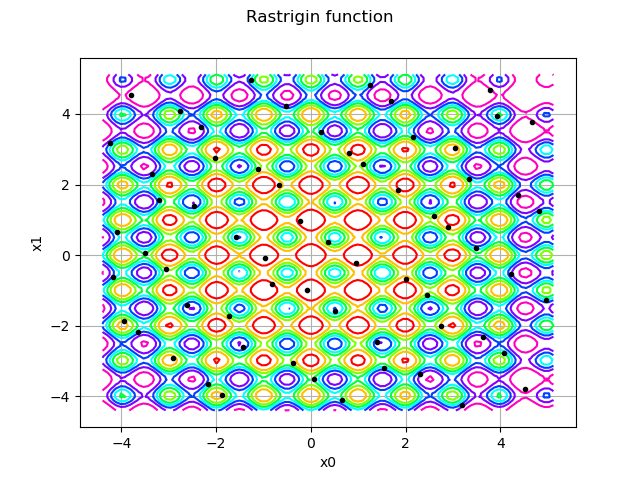
We see that the starting points are well spread across the input domain of the function.
Solve the optimization problem
solver.run()
result = solver.getResult()
xoptim = result.getOptimalPoint()
print(xoptim)
[3.86439e-06,-5.49779e-06]
xexact
[0.0, 0.0]
We can see that the solver found a very accurate approximation of the exact solution.
Analyze the optimization process
MultiStart ran an instance of Cobyla from each starting point.
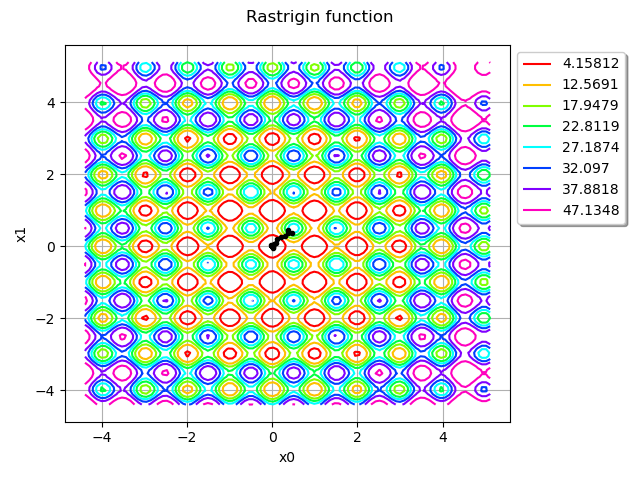
Let us focus on the instance that found the global minimum. How many times did it evaluate rastrigin?
result.getEvaluationNumber()
41
Let us view these evaluation points.
inputSample = result.getInputSample()
graph = rastrigin.draw(lowerbound, upperbound, [100] * dim)
graph.setTitle("Rastrigin function")
cloud = ot.Cloud(inputSample)
cloud.setPointStyle("bullet")
cloud.setColor("black")
graph.add(cloud)
view = viewer.View(graph, legend_kw={"bbox_to_anchor": (1, 1), "loc": "upper left"})
view.getFigure().tight_layout()
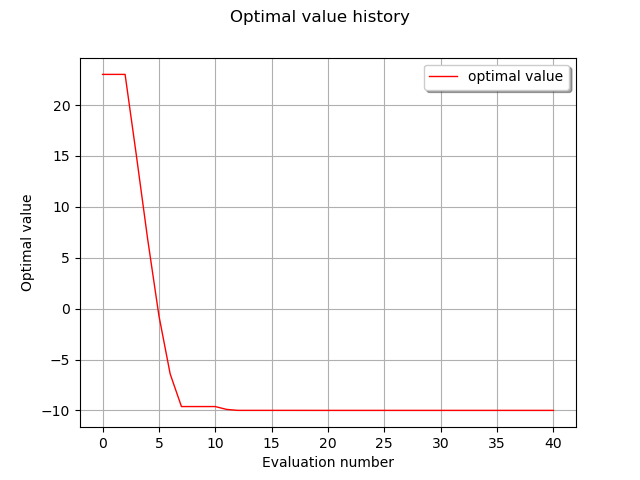
How fast did it find the global minimum?
graph = result.drawOptimalValueHistory()
view = viewer.View(graph)
Let us now analyze the MultiStart process as a whole.
Since rastrigin is a MemoizeFunction,
it has a getInputHistory() method
which lets us see all points it was evaluated on since its creation.
inputSample = rastrigin.getInputHistory()
graph = rastrigin.draw(lowerbound, upperbound, [100] * dim)
graph.setTitle("Rastrigin function")
cloud = ot.Cloud(inputSample)
cloud.setPointStyle("bullet")
cloud.setColor("black")
graph.add(cloud)
view = viewer.View(graph, legend_kw={"bbox_to_anchor": (1, 1), "loc": "upper left"})
view.getFigure().tight_layout()
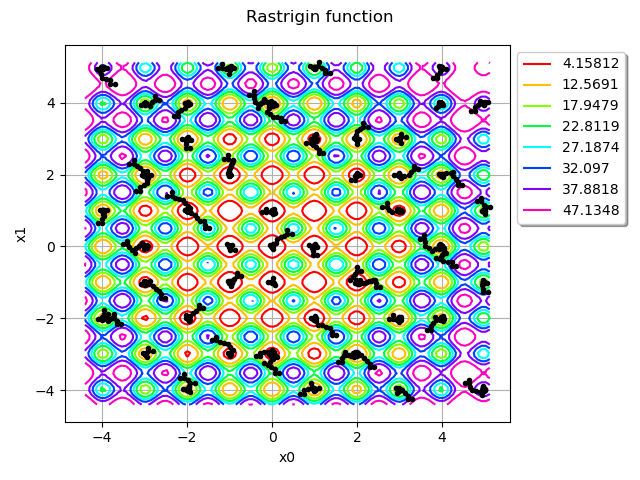
How many times did all Cobyla instances combined call rastrigin?
rastrigin.getInputHistory().getSize()
2327
Total running time of the script: ( 0 minutes 0.835 seconds)
 OpenTURNS