FloodModel
- class FloodModel(L=5000.0, B=300.0, trueKs=30.0, trueZv=50.0, trueZm=55.0)
Data class for the flood model.
- Parameters:
- Lfloat, optional
Length of the river. The default is 5000.0.
- Bfloat, optional
Width of the river. The default is 300.0.
- trueKsfloat, optional
The true value of the Ks parameter. The default is 30.0.
- trueZvfloat, optional
The true value of the Zv parameter. The default is 50.0.
- trueZmfloat, optional
The true value of the Zm parameter. The default is 55.0.
Examples
>>> from openturns.usecases import flood_model
>>> # Load the flood model
>>> fm = flood_model.FloodModel()
>>> print(fm.data[:5])
    [ Q ($m^3/s$) H (m)       ]
0 : [  130           0.59     ]
1 : [  530           1.33     ]
2 : [  960           2.03     ]
3 : [ 1400           2.72     ]
4 : [ 1830           2.83     ]
>>> print("Inputs:", fm.model.getInputDescription())
Inputs: [Q,Ks,Zv,Zm]
>>> print("Parameters:", fm.model.getParameterDescription())
Parameters: [B,L]
>>> print("Outputs:", fm.model.getOutputDescription())
Outputs: [H]
- Attributes:
- dimThe dimension of the problem
dim=4
- Q
TruncatedDistributionof aGumbeldistribution ot.TruncatedDistribution(ot.Gumbel(558.0, 1013.0), 0.0, ot.TruncatedDistribution.LOWER)
- Ks
TruncatedDistributionof aNormaldistribution ot.TruncatedDistribution(ot.Normal(30.0, 7.5), 0.0, ot.TruncatedDistribution.LOWER)
- Zv
Uniformdistribution ot.Uniform(49.0, 51.0)
- Zm
Uniformdistribution ot.Uniform(54.0, 56.0)
- model
ParametricFunction The flood model. The function has input dimension 4 and output dimension 1. More precisely, we have
 and
and
 .
Its parameters are
.
Its parameters are  .
.- distribution
ComposedDistribution The joint distribution of the input parameters.
- data
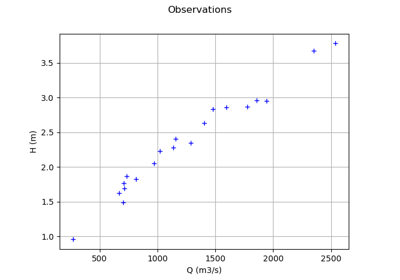
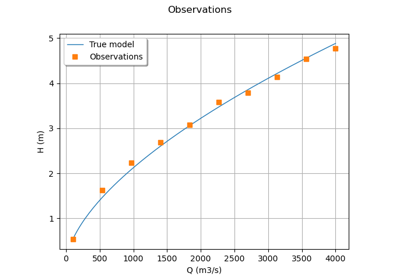
Sampleof size 10 and dimension 2 A data set which contains noisy observations of the flow rate (column 0) and the height (column 1).
- __init__(L=5000.0, B=300.0, trueKs=30.0, trueZv=50.0, trueZm=55.0)
Examples using the class

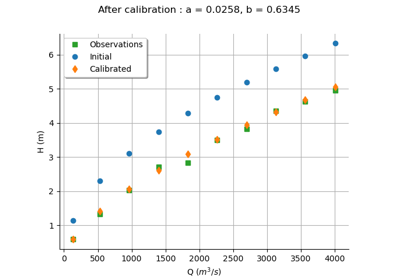
Calibrate a parametric model: a quick-start guide to calibration