Note
Go to the end to download the full example code.
Problem RP8
In this example, we present the RP8 problem of BBRC 2019 using the FORM SORM method and the Monte Carlo method.
import otbenchmark as otb
import matplotlib.pyplot as plt
problem = otb.ReliabilityProblem8()
print(problem)
name = RP8
event = class=ThresholdEventImplementation antecedent=class=CompositeRandomVector function=class=Function name=Unnamed implementation=class=FunctionImplementation name=Unnamed description=[x1,x2,x3,x4,x5,x6,y0] evaluationImplementation=class=SymbolicEvaluation name=Unnamed inputVariablesNames=[x1,x2,x3,x4,x5,x6] outputVariablesNames=[y0] formulas=[x1 + 2 * x2 + 2 * x3 + x4 - 5 * x5 - 5 * x6] gradientImplementation=class=SymbolicGradient name=Unnamed evaluation=class=SymbolicEvaluation name=Unnamed inputVariablesNames=[x1,x2,x3,x4,x5,x6] outputVariablesNames=[y0] formulas=[x1 + 2 * x2 + 2 * x3 + x4 - 5 * x5 - 5 * x6] hessianImplementation=class=SymbolicHessian name=Unnamed evaluation=class=SymbolicEvaluation name=Unnamed inputVariablesNames=[x1,x2,x3,x4,x5,x6] outputVariablesNames=[y0] formulas=[x1 + 2 * x2 + 2 * x3 + x4 - 5 * x5 - 5 * x6] antecedent=class=UsualRandomVector distribution=class=JointDistribution name=JointDistribution dimension=6 copula=class=IndependentCopula name=IndependentCopula dimension=6 marginal[0]=class=ParametrizedDistribution parameters=class=LogNormalMuSigma name=Unnamed mu=120 sigma=12 gamma=0 distribution=class=LogNormal name=LogNormal dimension=1 muLog=4.78252 sigmaLog=0.0997513 gamma=0 marginal[1]=class=ParametrizedDistribution parameters=class=LogNormalMuSigma name=Unnamed mu=120 sigma=12 gamma=0 distribution=class=LogNormal name=LogNormal dimension=1 muLog=4.78252 sigmaLog=0.0997513 gamma=0 marginal[2]=class=ParametrizedDistribution parameters=class=LogNormalMuSigma name=Unnamed mu=120 sigma=12 gamma=0 distribution=class=LogNormal name=LogNormal dimension=1 muLog=4.78252 sigmaLog=0.0997513 gamma=0 marginal[3]=class=ParametrizedDistribution parameters=class=LogNormalMuSigma name=Unnamed mu=120 sigma=12 gamma=0 distribution=class=LogNormal name=LogNormal dimension=1 muLog=4.78252 sigmaLog=0.0997513 gamma=0 marginal[4]=class=ParametrizedDistribution parameters=class=LogNormalMuSigma name=Unnamed mu=50 sigma=10 gamma=0 distribution=class=LogNormal name=LogNormal dimension=1 muLog=3.89241 sigmaLog=0.198042 gamma=0 marginal[5]=class=ParametrizedDistribution parameters=class=LogNormalMuSigma name=Unnamed mu=40 sigma=8 gamma=0 distribution=class=LogNormal name=LogNormal dimension=1 muLog=3.66927 sigmaLog=0.198042 gamma=0 operator=class=Less name=Unnamed threshold=0
probability = 0.0007897927545598118
event = problem.getEvent()
g = event.getFunction()
Compute the bounds of the domain
inputVector = event.getAntecedent()
distribution = inputVector.getDistribution()
inputDimension = distribution.getDimension()
print(inputDimension)
6
alpha = 1.0 - 1.0e-5
bounds, marginalProb = distribution.computeMinimumVolumeIntervalWithMarginalProbability(
    alpha
)
referencePoint = distribution.getMean()
print(referencePoint)
[120,120,120,120,50,40]
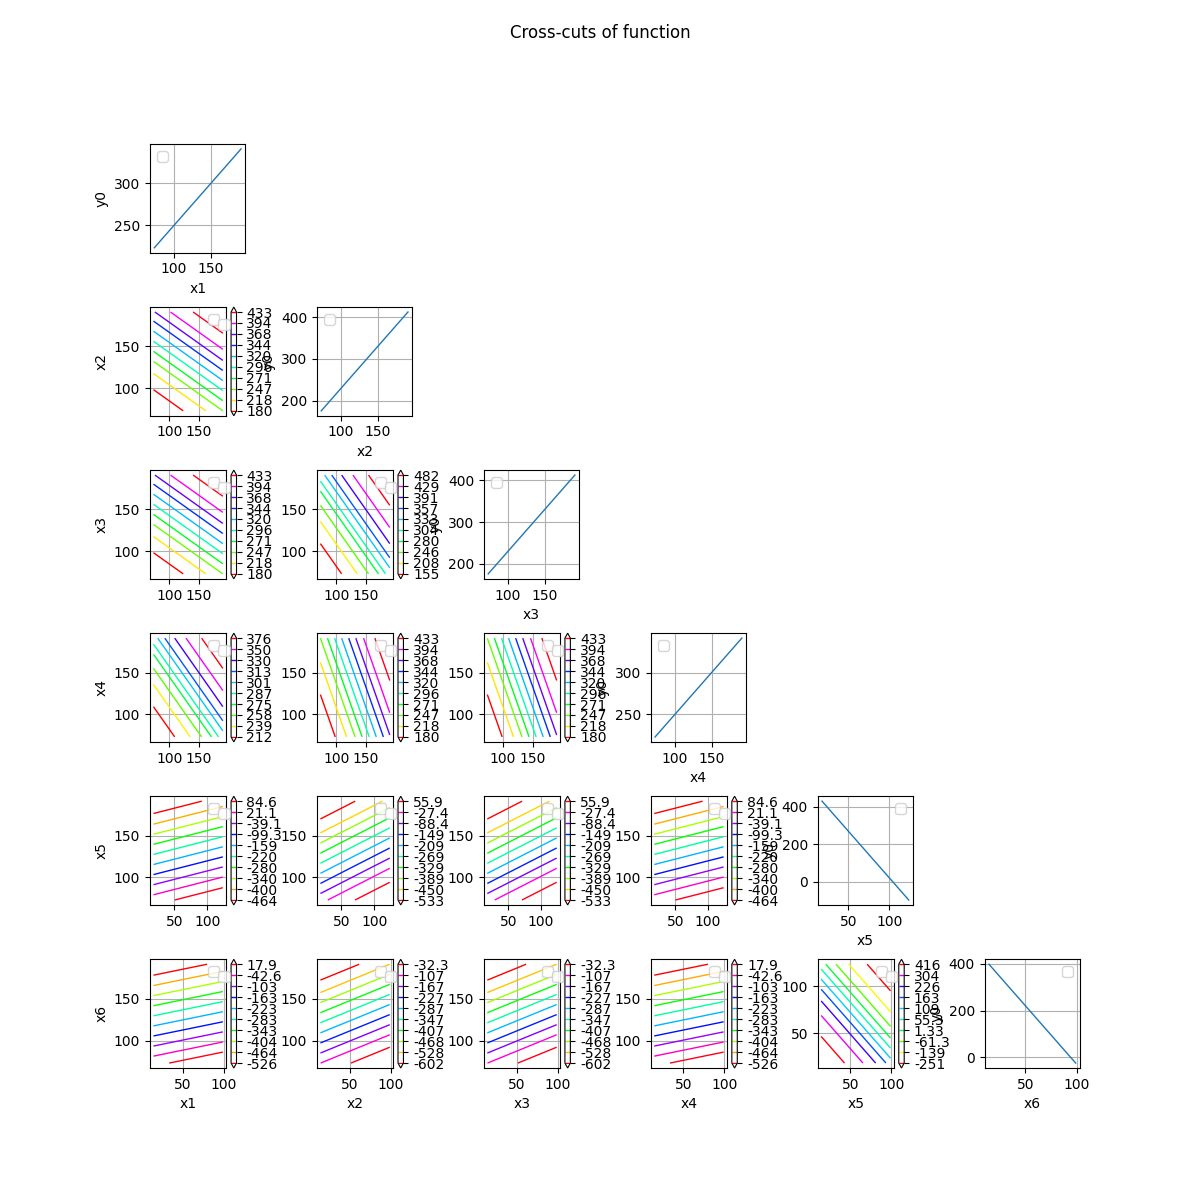
crossCut = otb.CrossCutFunction(g, referencePoint)
fig = crossCut.draw(bounds)
# Remove the legend labels because there
# are too many for such a small figure
for ax in fig.axes:
    ax.legend("")
# Increase space between sub-figures so that
# there are no overlap
plt.subplots_adjust(hspace=0.5, wspace=0.75)
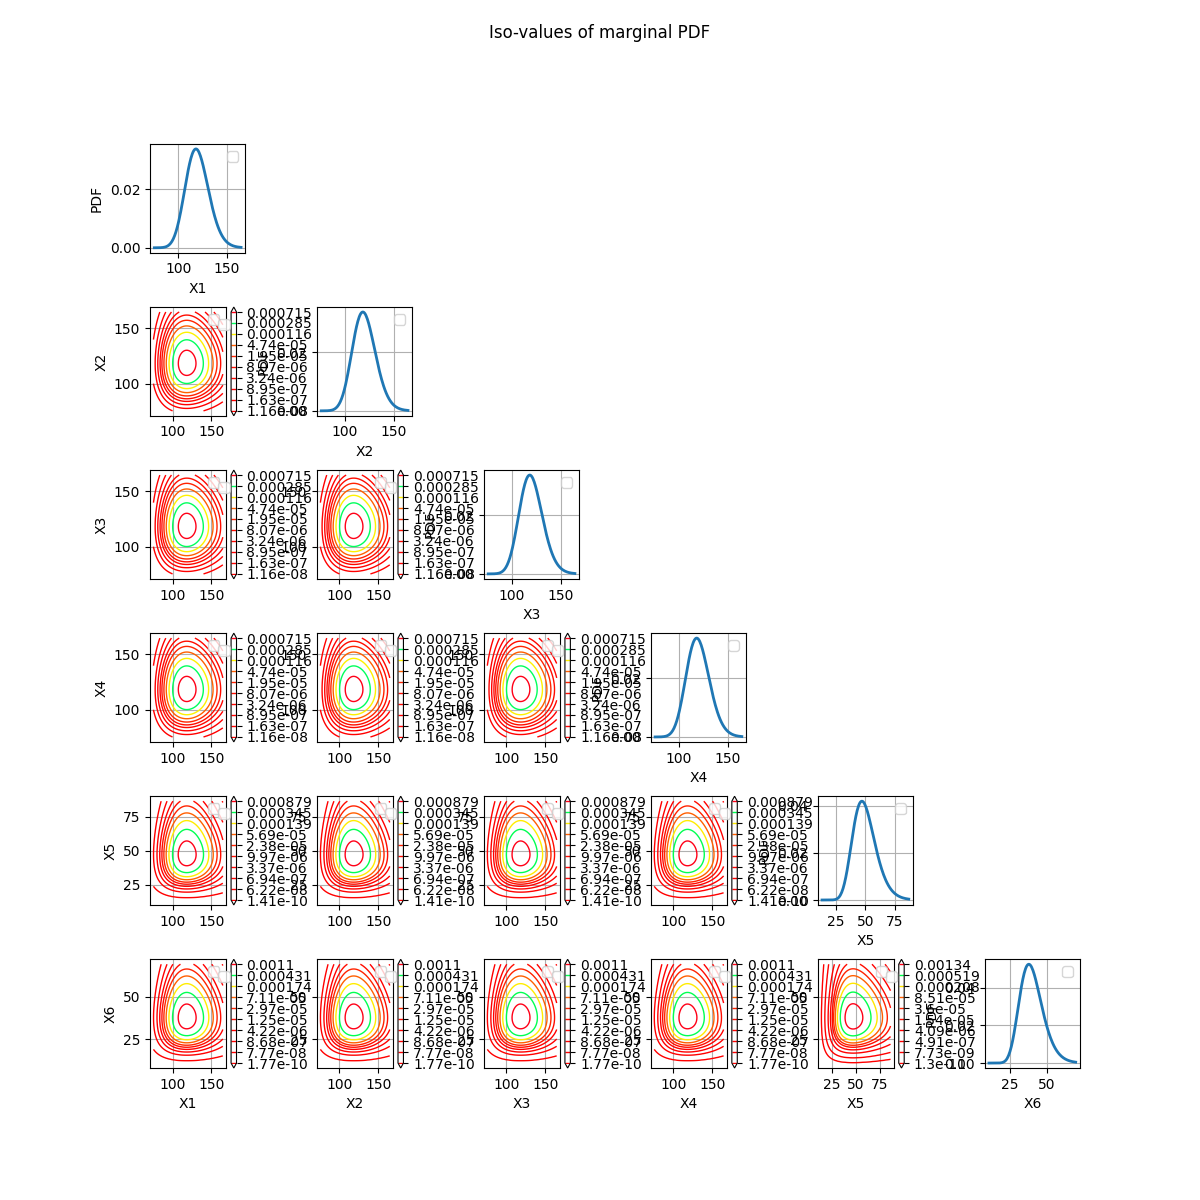
Plot cross-cuts of the distribution
crossCut = otb.CrossCutDistribution(distribution)
fig = crossCut.drawMarginalPDF()
# Remove the legend labels because there
# are too many for such a small figure
for ax in fig.axes:
    ax.legend("")
# Increase space between sub-figures so that
# there are no overlap
plt.subplots_adjust(hspace=0.5, wspace=0.75)
The correct way to represent cross-cuts of a distribution is to draw the contours of the PDF of the conditional distribution.
fig = crossCut.drawConditionalPDF(referencePoint)
# Remove the legend labels because there
# are too many for such a small figure
for ax in fig.axes:
    ax.legend("")
# Increase space between sub-figures so that
# there are no overlap
plt.subplots_adjust(hspace=0.5, wspace=0.75)

Descr =  1 0
Descr =  2 0
Descr =  2 1
Descr =  3 0
Descr =  3 1
Descr =  3 2
Descr =  4 0
Descr =  4 1
Descr =  4 2
Descr =  4 3
Descr =  5 0
Descr =  5 1
Descr =  5 2
Descr =  5 3
Descr =  5 4
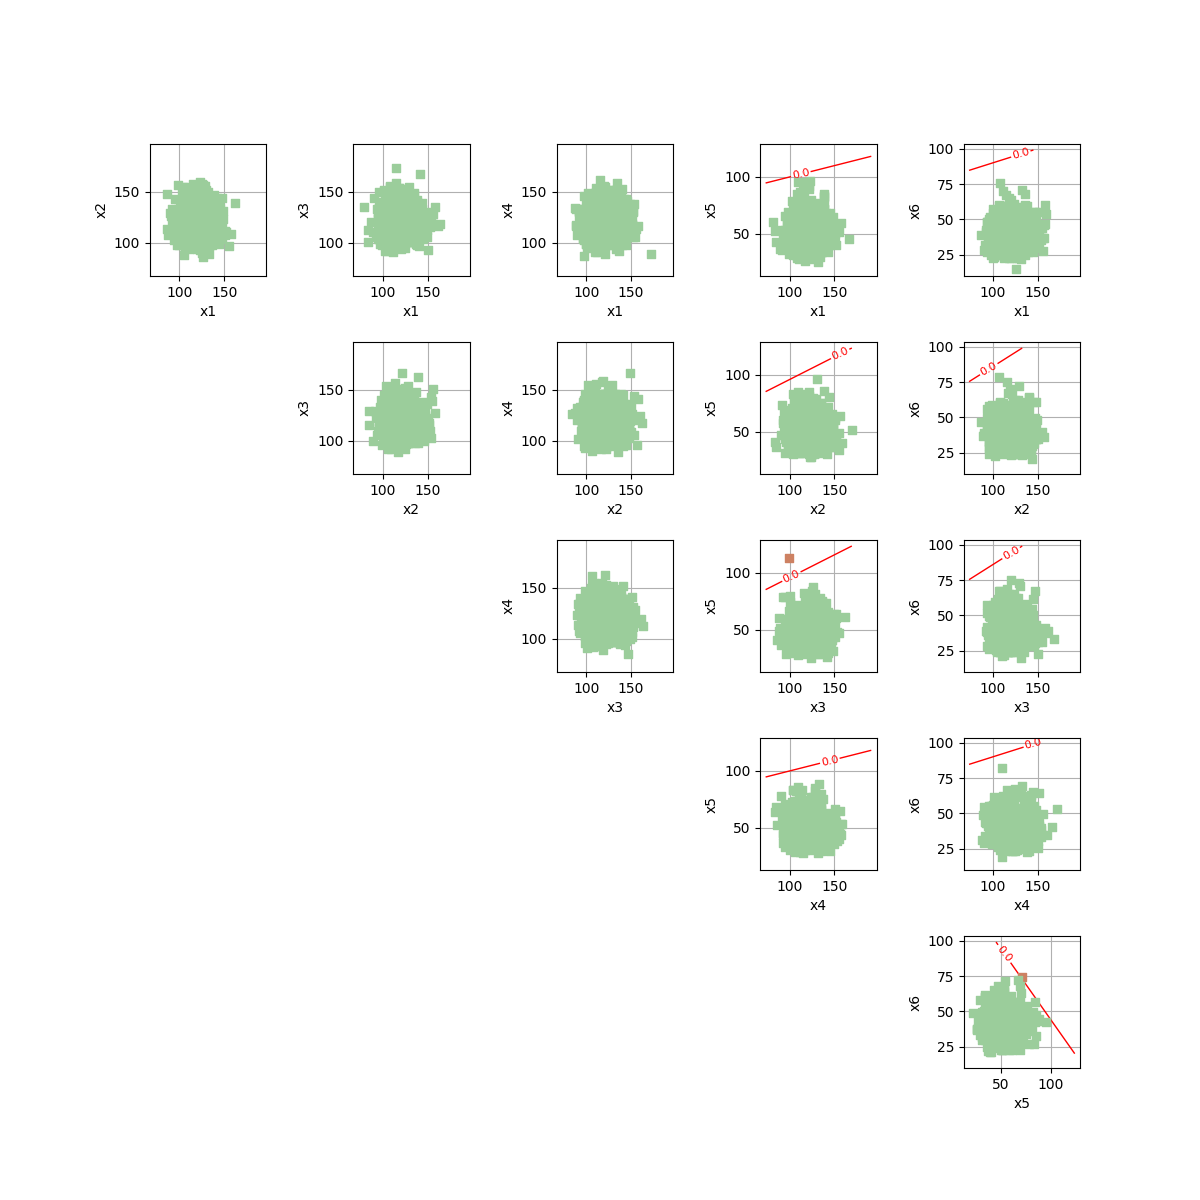
inputVector = event.getAntecedent()
event = problem.getEvent()
g = event.getFunction()
drawEvent = otb.DrawEvent(event)
_ = drawEvent.draw(bounds)
# Increase space between sub-figures so that
# there are no overlap
plt.subplots_adjust(hspace=0.5, wspace=0.75)
Total running time of the script: (0 minutes 8.547 seconds)