Note
Go to the end to download the full example code.
Calibration example#
The objective of this example is to define a physical model using the otfmi library
and to calibrate its parameters to fit the observed data.
This uses the openturns.NonLinearLeastSquaresCalibration class.
The data is sourced from [anonymous1978], who describes an influenza epidemic within a school setting.
Meaning of variables:
infection_rate (or “beta”): average number of contacts per person per time, multiplied by the probability of disease transmission in a contact between a susceptible and an infectious subject
healing_rate (unit : 1/day) (or “gamma”): rate at which infected individuals transition from the Infected (I) category to the Recovered (R) category.
Other variables:
D : average duration of infection (unit : days) D = 1 / gamma
R0 : number of contacts by an infectious individual with others before the infectious has been removed R0 = beta / gamma
Setup finite difference step#
The infection rate and healing rate are both of order 1, so no rescaling is needed. We use near-optimal finite difference steps for the gradient computation. These values were computed using numericalderivative, a Python package which computes the near to optimal differentiation step of a computer code (see https://github.com/mbaudin47/numericalderivative).
Cache memory#
The problem is that the PointToFieldFunction has no MemoizeFunction: https://github.com/openturns/openturns/issues/2802 The current code implements its own cache.
References#
Girard2024: OtFMI: interfacing OpenTURNS with the leading standard for model exchange 14th June 2024, Sylvain Girard (girard@phimeca.com), Pascal Borel (pascal.borel@edf.fr)
Girard2019: S. Girard, A probabilistic take on system modeling with Modelica and Python, February 2019, https://sylvaingirard.net/pdf/girard17-probabilistic_modelica_python.pdf
import otfmi
import otfmi.example.utility
import openturns as ot
import openturns.viewer as otv
import pyfmi
from matplotlib import pylab as plt
ot.ResourceMap.SetAsString("Contour-DefaultColorMap", "viridis")
Define bounds for parameters
infection_rate_min = 1.0  # beta
infection_rate_max = 3.0
healing_rate_min = 0.1  # gamma
healing_rate_max = 0.9
infection_rate = 2.0  # beta (/ day)
healing_rate = 0.5  # gamma (/ day)
total_population = 763.0
reference_parameters = [infection_rate, healing_rate]
print("References parameters = ")
print(f"infection_rate = {infection_rate}")
print(f"healing_rate = {healing_rate}")
References parameters =
infection_rate = 2.0
healing_rate = 0.5
average_infection_duration = 1.0 / healing_rate
print(f"average_infection_duration = {average_infection_duration:.4f} (days)")
R0 = infection_rate / healing_rate
print(f"R0 = {R0:.4f}")
average_infection_duration = 2.0000 (days)
R0 = 4.0000
start_time = 0.0
final_time = 13.0
number_of_time_steps = 100
step = (final_time - start_time) / (number_of_time_steps - 1)
time_mesh = ot.RegularGrid(start_time, step, number_of_time_steps)
vertices = time_mesh.getVertices()
Select the FMU
path_fmu = otfmi.example.utility.get_path_fmu("epid")
print(f"path_fmu = {path_fmu}")
path_fmu = /tmp/otfmi/example/file/fmu/linux-x86_64/epid.fmu
Inspect variables
check_model = pyfmi.load_fmu(path_fmu)
list_of_variables = list(check_model.get_model_variables().keys())
for i in range(len(list_of_variables)):
    print(f"Variable #{i} / {len(list_of_variables)} = {list_of_variables[i]}")
Variable #0 / 9 = infected
Variable #1 / 9 = removed
Variable #2 / 9 = susceptible
Variable #3 / 9 = der(infected)
Variable #4 / 9 = der(removed)
Variable #5 / 9 = der(susceptible)
Variable #6 / 9 = healing_rate
Variable #7 / 9 = infection_rate
Variable #8 / 9 = total_pop
Create function
p2f = otfmi.FMUPointToFieldFunction(
    path_fmu,
    mesh=time_mesh,
    inputs_fmu=["infection_rate", "healing_rate", "total_pop"],
    outputs_fmu=["infected"],
    start_time=start_time,
    final_time=final_time,
)
Evaluate model
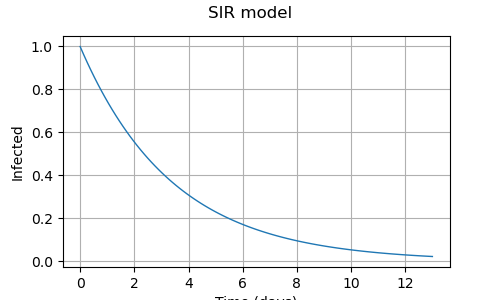
Get the number of infected
infected = [v[0] for v in y]
infected[:5]
[1.0, 1.2127536582343519, 1.470616046944194, 1.7830796913368827, 2.161601387286066]
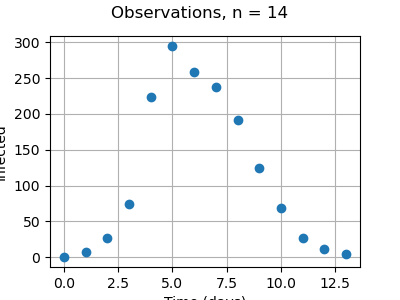
Data (time, confined, convalescent)
Select the number of observations to consider full dataset : number_of_observations = 14
number_of_observations = 14
timeObservations = data[:, 0]
timeObservations
graph = ot.Graph(
    f"Observations, n = {number_of_observations}", "Time (days)", "Infected", True
)
cloud = ot.Cloud(timeObservations, populationObservations)
cloud.setPointStyle("circle")
graph.add(cloud)
_ = otv.View(graph, figure_kw={"figsize": (4.0, 4.0)})
Create an epidemiological model, evaluated at one single time.
class SIRModelPointwise(ot.OpenTURNSPythonFunction):
    def __init__(
        self,
        path_fmu,
        total_pop=763.0,
        parameter_threshold=1.0e-14,
        start_time=0.0,
        step=1.0,
        number_of_time_steps=14,
        verbose=False,
    ) -> None:
        """
        Create an epidemiological model

        Parameters
        ----------
        path_fmu : str
            The path to the FMU file.
        total_pop : float, > 0
            The total population.
        parameter_threshold : float, > 0, close to zero
            If two vectors of parameters have an Euclidian distance lower
            than parameter_threshold, then these two parameters are considered equal.
            If a parameter vector is to be evaluated and is different from the
            previous one, then it is actually evaluated using the FMU model.
            In this case, the value of current_infected is updated.
            Otherwise, the value of current_infected is returned.
        start_time : float
            The initial time of the time interval.
        step : float, > 0
            The time step.
        number_of_time_steps : int
            The number of time values to be considered.

        """
        self.path_fmu = path_fmu

        super().__init__(3, 1)

        self.setInputDescription(["t", "Infection_rate", "Healing_rate"])
        self.setOutputDescription(["Infected"])
        self.current_parameters = None
        self.current_infected = None
        self.parameter_threshold = parameter_threshold
        self.total_pop = total_pop
        # Create mesh
        self.start_time = start_time
        self.step = step
        self.number_of_time_steps = number_of_time_steps
        self.final_time = start_time + (number_of_time_steps - 1) * step
        if verbose:
            print(f"start_time = {self.start_time}")
            print(f"step = {self.step}")
            print(f"number_of_time_steps = {self.number_of_time_steps}")
            print(f"final_time = {self.final_time}")
        self.time_mesh = ot.RegularGrid(start_time, step, number_of_time_steps)
        # Create model
        self.FMUmodel = otfmi.FMUPointToFieldFunction(
            path_fmu,
            mesh=self.time_mesh,
            inputs_fmu=["infection_rate", "healing_rate", "total_pop"],
            outputs_fmu=["infected"],
            start_time=self.start_time,
            final_time=self.final_time,
        )
        self.verbose = verbose

    def _exec(self, X):
        """
        Evaluate the FMU model

        Parameters
        ----------
        X : ot.Point(3)
            The variables (t, infection_rate, healing_rate)

        Returns
        -------
        Y : ot.Point(1)
            The number of infected at time t.
        """
        t, infection_rate, healing_rate = X
        # See if parameters are different from the previous ones
        if self.current_parameters is None:
            is_parameter_different = True
        else:
            current_parameters = ot.Point([infection_rate, healing_rate])
            change_parameter = current_parameters - self.current_parameters
            is_parameter_different = change_parameter.norm() > self.parameter_threshold
        if self.verbose:
            print(f"Is parameter different? {is_parameter_different}")
        # Update the number of infected, if necessary
        if is_parameter_different:
            self.current_parameters = ot.Point([infection_rate, healing_rate])
            current_input = ot.Point([infection_rate, healing_rate, self.total_pop])
            self.current_infected = self.FMUmodel(current_input).asPoint()
            if self.verbose:
                print("New parameters! Update number of infected.")
                print(f"current_parameters = {self.current_parameters}")
                print(f"current_infected = {self.current_infected}")
        # Get the number of infected corresponding to the given time
        if t < self.start_time or t > self.final_time:
            raise ValueError(
                f"Time t = {t} is not in time range [{self.start_time}, {self.final_time}]"
            )
        relative_time_step = (t - self.start_time) / self.step
        time_index = int(round(relative_time_step))
        time_index = min(time_index, self.number_of_time_steps - 1)
        current_infected = self.current_infected[time_index]
        if self.verbose:
            print(f"Time = {t}, index = {time_index}, infected = {current_infected}")
        return [current_infected]
epidemiologicModel = SIRModelPointwise(
    path_fmu, number_of_time_steps=number_of_observations, verbose=False
)
epidemiologicModel
OpenTURNSPythonFunction( ['t', 'Infection_rate', 'Healing_rate'] #3 ) -> ['Infected'] #1
model = ot.Function(epidemiologicModel)
Setup finite difference step.
gradStep = ot.ConstantStep([1.0, 3.0e-08, 7.4e-09])  # Constant gradient step
model.setGradient(ot.CenteredFiniteDifferenceGradient(gradStep, model.getEvaluation()))
print("Physical Model Inputs:", model.getInputDescription())
print("Physical Model Parameters:", model.getParameterDescription())
Physical Model Inputs: [t,Infection_rate,Healing_rate]
Physical Model Parameters: []
infection_rate = 1.0
healing_rate = 0.2
thetaPrior = [infection_rate, healing_rate]
epidParametric = ot.ParametricFunction(model, [1, 2], thetaPrior)
print("Parametric Model Inputs:", epidParametric.getInputDescription())
print("Parametric Model Parameters:", epidParametric.getParameterDescription())
Parametric Model Inputs: [t]
Parametric Model Parameters: [Infection_rate,Healing_rate]
     [ Infected  ]
 0 : [   1       ]
 1 : [   2.20284 ]
 2 : [   4.83798 ]
 3 : [  10.5589  ]
 4 : [  22.7305  ]
 5 : [  47.5492  ]
 6 : [  93.9596  ]
 7 : [ 167.753   ]
 8 : [ 257.453   ]
 9 : [ 331.277   ]
10 : [ 364.39    ]
11 : [ 358.5     ]
12 : [ 329.127   ]
13 : [ 290.144   ]
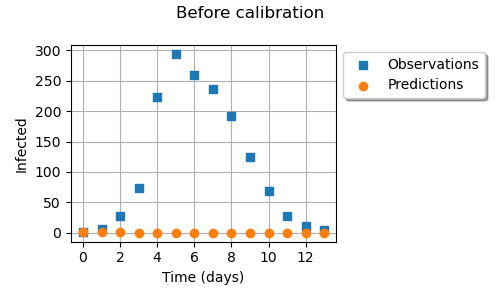
graph = ot.Graph("Before calibration", "Time (days)", "Infected", True, "upper left")
# Observations
cloud = ot.Cloud(timeObservations, populationObservations)
cloud.setLegend("Observations")
cloud.setPointStyle(
    ot.ResourceMap.GetAsString("CalibrationResult-ObservationPointStyle")
)
graph.add(cloud)
# Predictions
cloud = ot.Cloud(timeObservations, populationPredicted)
cloud.setLegend("Predictions")
cloud.setPointStyle(ot.ResourceMap.GetAsString("CalibrationResult-PriorPointStyle"))
graph.add(cloud)
graph.setLegendPosition("upper left")
graph.setLegendCorner([1.0, 1.0])
graph.setIntegerXTick(True)
view = otv.View(graph, figure_kw={"figsize": (5.0, 4.0)})
Evaluate the model at a single time
def plotDistributionGridPDF(distribution):
    """
    Plot the marginal and bi-dimensional iso-PDF on a grid.

    Parameters
    ----------
    distribution : ot.Distribution
        The distribution.

    Returns
    -------
    grid : ot.GridLayout(dimension, dimension)
        The grid of plots.

    """
    dimension = distribution.getDimension()
    grid = ot.GridLayout(dimension, dimension)
    for i in range(dimension):
        for j in range(dimension):
            if i == j:
                distributionI = distribution.getMarginal([i])
                graph = distributionI.drawPDF()
            else:
                distributionJI = distribution.getMarginal([j, i])
                graph = distributionJI.drawPDF()
            graph.setLegends([""])
            graph.setTitle("")
            if i < dimension - 1:
                graph.setXTitle("")
            if j > 0:
                graph.setYTitle("")
            grid.setGraph(i, j, graph)
    grid.setTitle("Iso-PDF values")
    return grid
Calibration with non linear least squares Check that we can evaluate the parametric function.
ot.ResourceMap.SetAsUnsignedInteger("NonLinearLeastSquaresCalibration-BootstrapSize", 0)
calibrationAlgorithm = ot.NonLinearLeastSquaresCalibration(
    epidParametric, timeObservations, populationObservations, thetaPrior
)
calibrationAlgorithm.setOptimizationAlgorithm(ot.CMinpack())
calibrationAlgorithm.run()
calibrationResult = calibrationAlgorithm.getResult()
number_of_observations = calibrationResult.getInputObservations().getSize()
# Print theta
print(f"Analyse calibration : n.obs.= {number_of_observations}")
thetaPrior = calibrationResult.getParameterPrior().getMean()
thetaMAP = calibrationResult.getParameterMAP()
infection_rate_prior, healing_rate_prior = thetaPrior
infection_rate_MAP, healing_rate_MAP = thetaMAP
print(
    f"- theta Before = [{infection_rate_prior:.4f}, "
    f"{healing_rate_prior:.4f}]"
)
print(
    f"- theta After = [{infection_rate_MAP:.4f}, "
    f"{healing_rate_MAP:.4f}]"
)
Analyse calibration : n.obs.= 14
- theta Before = [1.0000, 0.2000]
- theta After = [1.9793, 0.4755]
Compute confidence interval of theta
thetaPosterior = calibrationResult.getParameterPosterior()
alpha = 0.95
interval = thetaPosterior.computeBilateralConfidenceIntervalWithMarginalProbability(
    alpha
)[0]
lower_bound = interval.getLowerBound()
upper_bound = interval.getUpperBound()
print(f"Confidence interval with level {alpha}")
print(
    f"- infection_rate in [{lower_bound[0]:.4f}, \
                           {upper_bound[0]:.4f}]"
)
print(f"- healing_rate in [{lower_bound[1]:.4f}, {upper_bound[1]:.4f}]")
Confidence interval with level 0.95
- infection_rate in [1.9016,                            2.0570]
- healing_rate in [0.4322, 0.5188]
Print optimum parameters
infection_rate, healing_rate = thetaMAP
print("Optimum parameters = ")
print(f"- infection_rate = {infection_rate:.4f}")
print(f"- healing_rate = {healing_rate:.4f}")
#
print("Other parameters :")
average_infection_duration = 1.0 / healing_rate
print(f"- average_infection_duration = {average_infection_duration:.3f} (days)")
R0 = infection_rate / healing_rate
print(f"- R0 = {R0:.6f}")
Optimum parameters =
- infection_rate = 1.9793
- healing_rate = 0.4755
Other parameters :
- average_infection_duration = 2.103 (days)
- R0 = 4.162539
Compute confidence interval of the residuals
thetaMAP = calibrationResult.getParameterMAP()
residual = calibrationResult.getResidualFunction()
residualMAP = ot.Sample.BuildFromPoint(residual(thetaMAP))
normalResidual = ot.NormalFactory().build(residualMAP)
alpha = 0.95
residualInterval = normalResidual.computeBilateralConfidenceInterval(alpha)
lower_bound = residualInterval.getLowerBound()[0]
upper_bound = residualInterval.getUpperBound()[0]
print(f"Residual, Normal {alpha} C.I. : [{lower_bound:.2f}, {upper_bound:.2f}]")
Residual, Normal 0.95 C.I. : [-39.67, 39.17]
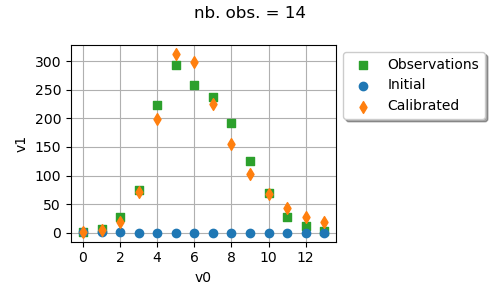
Draw observations vs predictions
ot.ResourceMap.SetAsUnsignedInteger("Distribution-DefaultPointNumber", 300)
graph = calibrationResult.drawObservationsVsInputs().getGraph(0, 0)
graph.setLegendPosition("upper left")
graph.setLegendCorner([1.0, 1.0])
graph.setIntegerXTick(True)
graph.setTitle(f"nb. obs. = {number_of_observations}")
_ = otv.View(graph, figure_kw={"figsize": (5.0, 4.0)})
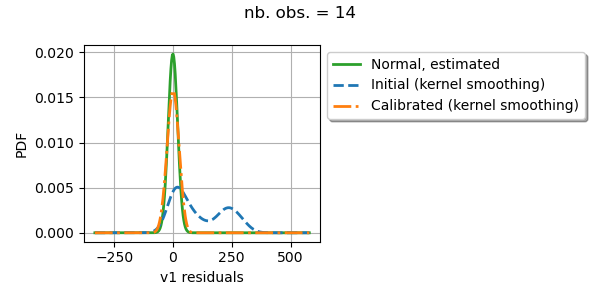
Draw residuals
graph = calibrationResult.drawResiduals().getGraph(0, 0)
graph.setLegendPosition("upper left")
graph.setLegendCorner([1.0, 1.0])
graph.setTitle(f"nb. obs. = {number_of_observations}")
_ = otv.View(graph, figure_kw={"figsize": (6.0, 4.0)})
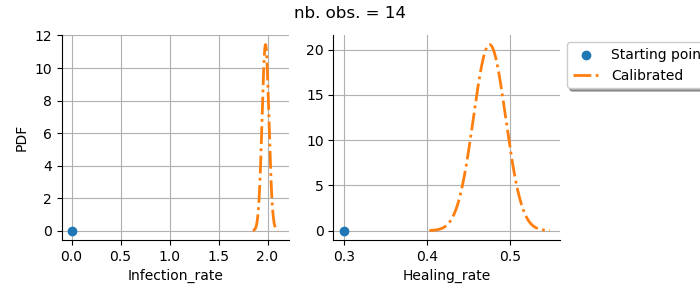
Plot parameters distributions
graph = calibrationResult.drawParameterDistributions()
graph.setTitle(f"nb. obs. = {number_of_observations}")
_ = otv.View(
    graph,
    figure_kw={"figsize": (7.0, 4.0)},
    legend_kw={"bbox_to_anchor": (1.0, 1.0), "loc": "upper left"},
)
plt.subplots_adjust(right=0.8, bottom=0.2)
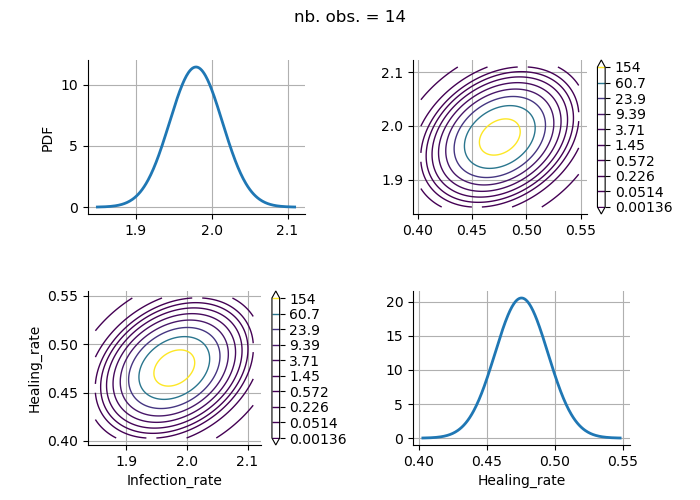
Plot parameters distributions
parameterDistribution = calibrationResult.getParameterPosterior()
grid = plotDistributionGridPDF(parameterDistribution)
grid.setTitle(f"nb. obs. = {number_of_observations}")
_ = otv.View(grid, figure_kw={"figsize": (7.0, 5.0)})
plt.subplots_adjust(wspace=0.5, hspace=0.5)
Total running time of the script: (0 minutes 6.651 seconds)