Note
Go to the end to download the full example code.
Estimate the probability of a threshold excedance
A load is applied to a cantilever beam. For construction reasons, the beam must not exceed a bending of 30 cm. The load (F), beam Young’s modulus (E), length (L) and section modulus (I) are uncertain.

See the cantilever beam model here.
What is the probability that the deviation exceeds the threshold ?
import openturns as ot
import otfmi
import otfmi.example.utility
import openturns.viewer as otv

path_fmu = otfmi.example.utility.get_path_fmu("deviation")
We load the FMU as a FMUFunction here as the event
explicitely requires a function of type openturns.Function.
model_fmu = otfmi.FMUFunction(
    path_fmu, inputs_fmu=["E", "F", "L", "I"], outputs_fmu="y"
)
We test the function wrapping the deviation model on a point:
Running the FMU: deviation = 10.527857142857142
We define probability laws on the 4 uncertain inputs:
E = ot.Beta(0.93, 3.2, 2.8e7, 4.8e7)
F = ot.LogNormal()
F.setParameter(ot.LogNormalMuSigma()([30.0e3, 9e3, 15.0e3]))
L = ot.Uniform(250.0, 260.0)
II = ot.Beta(2.5, 4.0, 310.0, 450.0)
According to the laws of mechanics, when the length L increases, the moment of inertia I decreases. The variables L and I are thus negatively correlated.
We assume that the random variables E, F, L and I are dependent and associated with a gaussian copula which correlation matrix:

We implement this correlation:
# Create the Spearman correlation matrix of the input random vector
RS = ot.CorrelationMatrix(4)
RS[2, 3] = -0.2

# Evaluate the correlation matrix of the Normal copula from RS
R = ot.NormalCopula.GetCorrelationFromSpearmanCorrelation(RS)

# Create the Normal copula parametrized by R
mycopula = ot.NormalCopula(R)
And we endly create the composed input probability distribution.
inputDistribution = ot.ComposedDistribution([E, F, L, II], mycopula)
inputDistribution.setDescription(model_fmu.getInputDescription())
Create the event whose probability we want to estimate:
inputRandomVector = ot.RandomVector(inputDistribution)
outputVariableOfInterest = ot.CompositeRandomVector(model_fmu, inputRandomVector)

threshold = 30
event = ot.ThresholdEvent(outputVariableOfInterest, ot.Greater(), threshold)
event.setName("Deviation > %g cm" % threshold)
Parameterize and run the Monte Carlo algorithm:
ot.RandomGenerator.SetSeed(23091926)  # set seed for reproducibility

experiment = ot.MonteCarloExperiment()
algo = ot.ProbabilitySimulationAlgorithm(event, experiment)
algo.setMaximumOuterSampling(200)
algo.setMaximumCoefficientOfVariation(0.2)
algo.run()
Draw the distribution of threshold excedance probability:
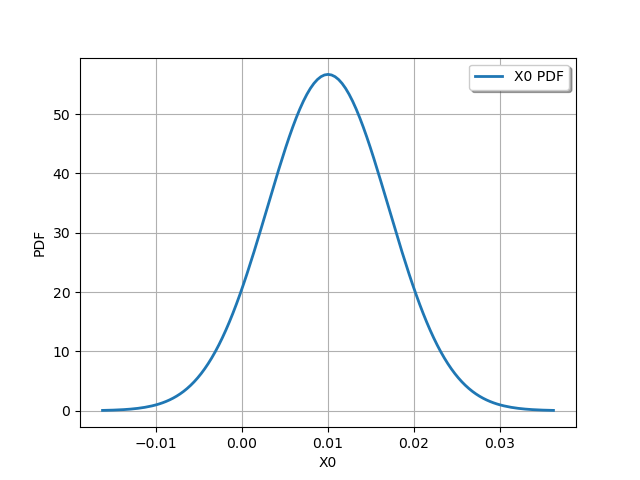
Get the probability with which the beam deviation exceeds 30 cm:
probability = monte_carlo_result.getProbabilityEstimate()
print(f"Threshold excedance probability: {probability}")
Threshold excedance probability: 0.009999999999999998
Given the uncertainties on the load applied and the beam mechanical parameters, the beam bending has a probability of 0.01 to exceed 30 cm. Is this probability low or not ? It depends on your context 🙂
Total running time of the script: (0 minutes 3.716 seconds)