ParametricFunction
- class ParametricFunction(*args)
Parametric function.
It defines a parametric function from function by freezing the variables marked by the indices set to the values of referencePoint.
Please read the example below and Create a parametric function for a detailed example of this class.
- Parameters:
- function
Function Function with full parameters from which the parametric function is built.
- indicessequence of int
Indices of the frozen variables.
- referencePointsequence of float
Values of the frozen variables. Must be of size of indices if parametersSet is True (default), else its size should be the complementary size of indices.
- parametersSetbool, optional
If True (default), the frozen variables are the ones referenced in indices. Otherwise, the set variables are the ones referenced in the complementary set of indices.
- function
Methods
draw(*args)Draw the output of function as a
Graph.drawCrossCuts(*args)Draw the 2D and 1D cross cuts of a 1D output function as a
GridLayout.Accessor to the number of direct calls to the function.
Accessor to the object's name.
Accessor to the description of the inputs and outputs.
Accessor to the evaluation function.
Accessor to the number of times the evaluation of the function has been called.
Accessor to the gradient function.
Accessor to the number of times the gradient of the function has been called.
Accessor to the hessian function.
Accessor to the number of times the hessian of the function has been called.
getId()Accessor to the object's id.
Accessor to the underlying implementation.
Accessor to the description of the input vector.
Accessor to the dimension of the input vector.
getMarginal(*args)Accessor to marginal.
getName()Accessor to the object's name.
Accessor to the description of the output vector.
Accessor to the number of the outputs.
Accessor to the parameter values.
Accessor to the parameter description.
Accessor to the dimension of the parameter.
gradient(inP)Return the Jacobian transposed matrix of the function at a point.
hessian(inP)Return the hessian of the function at a point.
isLinear()Accessor to the linearity of the function.
isLinearlyDependent(index)Accessor to the linearity of the function with regard to a specific variable.
parameterGradient(inP)Accessor to the gradient against the parameter.
setDescription(description)Accessor to the description of the inputs and outputs.
setEvaluation(evaluation)Accessor to the evaluation function.
setGradient(gradient)Accessor to the gradient function.
setHessian(hessian)Accessor to the hessian function.
setInputDescription(inputDescription)Accessor to the description of the input vector.
setName(name)Accessor to the object's name.
setOutputDescription(inputDescription)Accessor to the description of the output vector.
setParameter(parameter)Accessor to the parameter values.
setParameterDescription(description)Accessor to the parameter description.
setStopCallback(callBack[, state])Set up a stop callback.
Examples
>>> import openturns as ot
>>> f = ot.SymbolicFunction(['x', 'y', 'z'], ['x + y', 'x * z + y'])
>>> print(f)
[x,y,z]->[x + y,x * z + y]
Then create another function by setting x=2 and y=3:
>>> g=ot.ParametricFunction(f, [0,1], [2.0, 3.0])
>>> print(g)
ParametricEvaluation([x,y,z]->[x + y,x * z + y], parameters positions=[0,1], parameters=[x : 2, y : 3], input positions=[2])
Or by setting z=4 using the complementary set flag:
>>> g = ot.ParametricFunction(f, [0, 1], [4.0], False)
>>> print(g.getInputDescription())
[x,y]
>>> print(g)
ParametricEvaluation([x,y,z]->[x + y,x * z + y], parameters positions=[2], parameters=[z : 4], input positions=[0,1])
- __init__(*args)
- draw(*args)
Draw the output of function as a
Graph.- Available usages:
draw(inputMarg, outputMarg, centralPoint, xiMin, xiMax, ptNb, scale)
draw(firstInputMarg, secondInputMarg, outputMarg, centralPoint, xiMin_xjMin, xiMax_xjMax, ptNbs, scale, isFilled)
draw(xiMin, xiMax, ptNb, scale)
draw(xiMin_xjMin, xiMax_xjMax, ptNbs, scale)
- Parameters:
- outputMarg, inputMargint,

outputMarg is the index of the marginal to draw as a function of the marginal with index inputMarg.
- firstInputMarg, secondInputMargint,

In the 2D case, the marginal outputMarg is drawn as a function of the two marginals with indexes firstInputMarg and secondInputMarg.
- centralPointsequence of float
Central point with dimension equal to the input dimension of the function.
- xiMin, xiMaxfloat
Define the interval where the curve is plotted.
- xiMin_xjMin, xiMax_xjMaxsequence of float of dimension 2.
In the 2D case, define the intervals where the curves are plotted.
- ptNbint

The number of points to draw the curves.
- ptNbslist of int of dimension 2

The number of points to draw the contour in the 2D case.
- scalebool
scale indicates whether the logarithmic scale is used either for one or both axes:
ot.GraphImplementation.NONE or 0: no log scale is used,
ot.GraphImplementation.LOGX or 1: log scale is used only for horizontal data,
ot.GraphImplementation.LOGY or 2: log scale is used only for vertical data,
ot.GraphImplementation.LOGXY or 3: log scale is used for both data.
- isFilledbool
isFilled indicates whether the contour graph is filled or not
- outputMarg, inputMargint,
Notes
We note
 where
where  and
and
 ,
with
,
with  and
and  .
.In the first usage:
Draws graph of the given 1D outputMarg marginal
 as a function of the given 1D inputMarg
marginal with respect to the variation of
as a function of the given 1D inputMarg
marginal with respect to the variation of  in the interval
![[x_i^{min}, x_i^{max}]](data:image/svg+xml;base64,PD94bWwgdmVyc2lvbj0nMS4wJyBlbmNvZGluZz0nVVRGLTgnPz4KPCEtLSBUaGlzIGZpbGUgd2FzIGdlbmVyYXRlZCBieSBkdmlzdmdtIDMuNC4yIC0tPgo8c3ZnIHZlcnNpb249JzEuMScgeG1sbnM9J2h0dHA6Ly93d3cudzMub3JnLzIwMDAvc3ZnJyB4bWxuczp4bGluaz0naHR0cDovL3d3dy53My5vcmcvMTk5OS94bGluaycgd2lkdGg9JzU4LjMxNTIyM3B0JyBoZWlnaHQ9JzEyLjU5NjE2NnB0JyB2aWV3Qm94PScwIC05LjYwNzM3NCA1OC4zMTUyMjMgMTIuNTk2MTY2Jz4KPGRlZnM+CjxwYXRoIGlkPSdnMC05NycgZD0nTTMuMTI0Mjg0LTMuMDM2NjEzQzMuMDUyNTUzLTMuMTcyMTA1IDIuODIxNDItMy41MTQ4MTkgMi4zMzUyNDMtMy41MTQ4MTlDMS4zODY4LTMuNTE0ODE5IC4zNDI3MTUtMi40MDY5NzQgLjM0MjcxNS0xLjIyNzM5N0MuMzQyNzE1LS4zOTg1MDYgLjg3NjcxMiAuMDc5NzAxIDEuNDkwNDExIC4wNzk3MDFDMi4wMDA0OTggLjA3OTcwMSAyLjQzODg1NC0uMzI2Nzc1IDIuNTgyMzE2LS40ODYxNzdDMi43MjU3NzggLjA2Mzc2MSAzLjI2Nzc0NiAuMDc5NzAxIDMuMzYzMzg3IC4wNzk3MDFDMy43MzAwMTIgLjA3OTcwMSAzLjkxMzMyNS0uMjIzMTYzIDMuOTc3MDg2LS4zNTg2NTVDNC4xMzY0ODgtLjY0NTU3OSA0LjI0ODA3LTEuMTA3ODQ2IDQuMjQ4MDctMS4xMzk3MjZDNC4yNDgwNy0xLjE4NzU0NyA0LjIxNjE4OS0xLjI0MzMzNyA0LjEyMDU0OC0xLjI0MzMzN1M0LjAwODk2Ni0xLjE5NTUxNyAzLjk2MTE0Ni0uOTk2MjY0QzMuODQ5NTY0LS41NTc5MDggMy42OTgxMzItLjE0MzQ2MiAzLjM4NzI5OC0uMTQzNDYyQzMuMjAzOTg1LS4xNDM0NjIgMy4xMzIyNTQtLjI5NDg5NCAzLjEzMjI1NC0uNTE4MDU3QzMuMTMyMjU0LS42NTM1NDkgMy4yMDM5ODUtLjkyNDUzMyAzLjI1MTgwNi0xLjEyMzc4NlMzLjQxOTE3OC0xLjgwMTI0NSAzLjQ1MTA1OS0xLjk0NDcwN0wzLjYxMDQ2MS0yLjU1MDQzNkMzLjY1MDMxMS0yLjc0MTcxOSAzLjczNzk4My0zLjA3NjQ2MyAzLjczNzk4My0zLjExNjMxNEMzLjczNzk4My0zLjI5OTYyNiAzLjU4NjU1LTMuMzYzMzg3IDMuNDgyOTM5LTMuMzYzMzg3QzMuMzYzMzg3LTMuMzYzMzg3IDMuMTY0MTM0LTMuMjgzNjg2IDMuMTI0Mjg0LTMuMDM2NjEzWk0yLjU4MjMxNi0uODYwNzcyQzIuMTgzODExLS4zMTA4MzQgMS43NjkzNjUtLjE0MzQ2MiAxLjUxNDMyMS0uMTQzNDYyQzEuMTQ3Njk2LS4xNDM0NjIgLjk2NDM4NC0uNDc4MjA3IC45NjQzODQtLjg5MjY1M0MuOTY0Mzg0LTEuMjY3MjQ4IDEuMTc5NTc3LTIuMTIwMDUgMS4zNTQ5MTktMi40NzA3MzVDMS41ODYwNTItMi45NTY5MTIgMS45NzY1ODgtMy4yOTE2NTYgMi4zNDMyMTMtMy4yOTE2NTZDMi44NjEyNy0zLjI5MTY1NiAzLjAxMjcwMi0yLjcwOTgzOCAzLjAxMjcwMi0yLjYxNDE5N0MzLjAxMjcwMi0yLjU4MjMxNiAyLjgxMzQ1LTEuODAxMjQ1IDIuNzY1NjI5LTEuNTk0MDIyQzIuNjYyMDE3LTEuMjE5NDI3IDIuNjYyMDE3LTEuMjAzNDg3IDIuNTgyMzE2LS44NjA3NzJaJy8+CjxwYXRoIGlkPSdnMC0xMDUnIGQ9J00yLjM3NTA5My00Ljk3MzM1QzIuMzc1MDkzLTUuMTQ4NjkyIDIuMjQ3NTcyLTUuMjc2MjE0IDIuMDY0MjU5LTUuMjc2MjE0QzEuODU3MDM2LTUuMjc2MjE0IDEuNjI1OTAzLTUuMDg0OTMyIDEuNjI1OTAzLTQuODQ1ODI4QzEuNjI1OTAzLTQuNjcwNDg2IDEuNzUzNDI1LTQuNTQyOTY0IDEuOTM2NzM3LTQuNTQyOTY0QzIuMTQzOTYtNC41NDI5NjQgMi4zNzUwOTMtNC43MzQyNDcgMi4zNzUwOTMtNC45NzMzNVpNMS4yMTE0NTctMi4wNDgzMTlMLjc4MTA3MS0uOTQ4NDQzQy43NDEyMi0uODI4ODkyIC43MDEzNy0uNzMzMjUgLjcwMTM3LS41OTc3NThDLjcwMTM3LS4yMDcyMjMgMS4wMDQyMzQgLjA3OTcwMSAxLjQyNjY1IC4wNzk3MDFDMi4xOTk3NTEgLjA3OTcwMSAyLjUyNjUyNi0xLjAzNjExNSAyLjUyNjUyNi0xLjEzOTcyNkMyLjUyNjUyNi0xLjIxOTQyNyAyLjQ2Mjc2NS0xLjI0MzMzNyAyLjQwNjk3NC0xLjI0MzMzN0MyLjMxMTMzMy0xLjI0MzMzNyAyLjI5NTM5Mi0xLjE4NzU0NyAyLjI3MTQ4Mi0xLjEwNzg0NkMyLjA4ODE2OS0uNDcwMjM3IDEuNzYxMzk1LS4xNDM0NjIgMS40NDI1OS0uMTQzNDYyQzEuMzQ2OTQ5LS4xNDM0NjIgMS4yNTEzMDgtLjE4MzMxMyAxLjI1MTMwOC0uMzk4NTA2QzEuMjUxMzA4LS41ODk3ODggMS4zMDcwOTgtLjczMzI1IDEuNDEwNzEtLjk4MDMyNEMxLjQ5MDQxMS0xLjE5NTUxNyAxLjU3MDExMi0xLjQxMDcxIDEuNjU3NzgzLTEuNjI1OTAzTDEuOTA0ODU3LTIuMjcxNDgyQzEuOTc2NTg4LTIuNDU0Nzk1IDIuMDcyMjI5LTIuNzAxODY4IDIuMDcyMjI5LTIuODM3MzZDMi4wNzIyMjktMy4yMzU4NjYgMS43NTM0MjUtMy41MTQ4MTkgMS4zNDY5NDktMy41MTQ4MTlDLjU3Mzg0OC0zLjUxNDgxOSAuMjM5MTAzLTIuMzk5MDA0IC4yMzkxMDMtMi4yOTUzOTJDLjIzOTEwMy0yLjIyMzY2MSAuMjk0ODk0LTIuMTkxNzgxIC4zNTg2NTUtMi4xOTE3ODFDLjQ2MjI2Ny0yLjE5MTc4MSAuNDcwMjM3LTIuMjM5NjAxIC40OTQxNDctMi4zMTkzMDNDLjcxNzMxLTMuMDc2NDYzIDEuMDgzOTM1LTMuMjkxNjU2IDEuMzIzMDM5LTMuMjkxNjU2QzEuNDM0NjItMy4yOTE2NTYgMS41MTQzMjEtMy4yNTE4MDYgMS41MTQzMjEtMy4wMjg2NDNDMS41MTQzMjEtMi45NDg5NDEgMS41MDYzNTEtMi44MzczNiAxLjQyNjY1LTIuNTk4MjU3TDEuMjExNDU3LTIuMDQ4MzE5WicvPgo8cGF0aCBpZD0nZzAtMTA5JyBkPSdNMS41OTQwMjItMS4zMDcwOThDMS42MTc5MzMtMS40MjY2NSAxLjY5NzYzNC0xLjcyOTUxNCAxLjcyMTU0NC0xLjg0OTA2NkMxLjc0NTQ1NS0xLjkyODc2NyAxLjc5MzI3NS0yLjEyMDA1IDEuODA5MjE1LTIuMTk5NzUxQzEuODI1MTU2LTIuMjM5NjAxIDIuMDg4MTY5LTIuNzU3NjU5IDIuNDM4ODU0LTMuMDIwNjcyQzIuNzA5ODM4LTMuMjI3ODk1IDIuOTcyODUyLTMuMjkxNjU2IDMuMTk2MDE1LTMuMjkxNjU2QzMuNDkwOTA5LTMuMjkxNjU2IDMuNjUwMzExLTMuMTE2MzE0IDMuNjUwMzExLTIuNzQ5Njg5QzMuNjUwMzExLTIuNTU4NDA2IDMuNjAyNDkxLTIuMzc1MDkzIDMuNTE0ODE5LTIuMDE2NDM4QzMuNDU5MDI5LTEuODA5MjE1IDMuMzIzNTM3LTEuMjc1MjE4IDMuMjc1NzE2LTEuMDYwMDI1TDMuMTU2MTY0LS41ODE4MThDMy4xMTYzMTQtLjQ0NjMyNiAzLjA2MDUyMy0uMjA3MjIzIDMuMDYwNTIzLS4xNjczNzJDMy4wNjA1MjMgLjAxNTk0IDMuMjExOTU1IC4wNzk3MDEgMy4zMTU1NjcgLjA3OTcwMUMzLjQ1OTAyOSAuMDc5NzAxIDMuNTc4NTgtLjAxNTk0IDMuNjM0MzcxLS4xMTE1ODJDMy42NTgyODEtLjE1OTQwMiAzLjcyMjA0Mi0uNDMwMzg2IDMuNzYxODkzLS41OTc3NThMMy45NDUyMDUtMS4zMDcwOThDMy45NjkxMTYtMS40MjY2NSA0LjA0ODgxNy0xLjcyOTUxNCA0LjA3MjcyNy0xLjg0OTA2NkM0LjE4NDMwOS0yLjI3OTQ1MiA0LjE4NDMwOS0yLjI4NzQyMiA0LjM2NzYyMS0yLjU1MDQzNkM0LjYzMDYzNS0yLjk0MDk3MSA1LjAwNTIzLTMuMjkxNjU2IDUuNTM5MjI4LTMuMjkxNjU2QzUuODI2MTUyLTMuMjkxNjU2IDUuOTkzNTI0LTMuMTI0Mjg0IDUuOTkzNTI0LTIuNzQ5Njg5QzUuOTkzNTI0LTIuMzExMzMzIDUuNjU4NzgtMS4zOTQ3NyA1LjUwNzM0Ny0xLjAxMjIwNEM1LjQyNzY0Ni0uODA0OTgxIDUuNDAzNzM2LS43NDkxOTEgNS40MDM3MzYtLjU5Nzc1OEM1LjQwMzczNi0uMTQzNDYyIDUuNzc4MzMxIC4wNzk3MDEgNi4xMjEwNDYgLjA3OTcwMUM2LjkwMjExNyAuMDc5NzAxIDcuMjI4ODkyLTEuMDM2MTE1IDcuMjI4ODkyLTEuMTM5NzI2QzcuMjI4ODkyLTEuMjE5NDI3IDcuMTY1MTMxLTEuMjQzMzM3IDcuMTA5MzQtMS4yNDMzMzdDNy4wMTM2OTktMS4yNDMzMzcgNi45OTc3NTgtMS4xODc1NDcgNi45NzM4NDgtMS4xMDc4NDZDNi43ODI1NjUtLjQ0NjMyNiA2LjQ0NzgyMS0uMTQzNDYyIDYuMTQ0OTU2LS4xNDM0NjJDNi4wMTc0MzUtLjE0MzQ2MiA1Ljk1MzY3NC0uMjIzMTYzIDUuOTUzNjc0LS40MDY0NzZTNi4wMTc0MzUtLjc2NTEzMSA2LjA5NzEzNi0uOTY0Mzg0QzYuMjE2Njg3LTEuMjY3MjQ4IDYuNTY3MzcyLTIuMTgzODExIDYuNTY3MzcyLTIuNjMwMTM3QzYuNTY3MzcyLTMuMjI3ODk1IDYuMTUyOTI3LTMuNTE0ODE5IDUuNTc5MDc4LTMuNTE0ODE5QzUuMDI5MTQxLTMuNTE0ODE5IDQuNTc0ODQ0LTMuMjI3ODk1IDQuMjE2MTg5LTIuNzMzNzQ4QzQuMTUyNDI4LTMuMzcxMzU3IDMuNjQyMzQxLTMuNTE0ODE5IDMuMjI3ODk1LTMuNTE0ODE5QzIuODYxMjctMy41MTQ4MTkgMi4zNzUwOTMtMy4zODcyOTggMS45MzY3MzctMi44MTM0NUMxLjg4MDk0Ni0zLjI5MTY1NiAxLjQ5ODM4MS0zLjUxNDgxOSAxLjEyMzc4Ni0zLjUxNDgxOUMuODQ0ODMyLTMuNTE0ODE5IC42NDU1NzktMy4zNDc0NDcgLjUxMDA4Ny0zLjA3NjQ2M0MuMzE4ODA0LTIuNzAxODY4IC4yMzkxMDMtMi4zMTEzMzMgLjIzOTEwMy0yLjI5NTM5MkMuMjM5MTAzLTIuMjIzNjYxIC4yOTQ4OTQtMi4xOTE3ODEgLjM1ODY1NS0yLjE5MTc4MUMuNDYyMjY3LTIuMTkxNzgxIC40NzAyMzctMi4yMjM2NjEgLjUyNjAyNy0yLjQzMDg4NEMuNjIxNjY5LTIuODIxNDIgLjc2NTEzMS0zLjI5MTY1NiAxLjA5OTg3NS0zLjI5MTY1NkMxLjMwNzA5OC0zLjI5MTY1NiAxLjM1NDkxOS0zLjA5MjQwMyAxLjM1NDkxOS0yLjkxNzA2MUMxLjM1NDkxOS0yLjc3MzU5OSAxLjMxNTA2OC0yLjYyMjE2NyAxLjI1MTMwOC0yLjM1OTE1M0MxLjIzNTM2Ny0yLjI5NTM5MiAxLjExNTgxNi0xLjgyNTE1NiAxLjA4MzkzNS0xLjcxMzU3NEwuNzg5MDQxLS41MTgwNTdDLjc1NzE2MS0uMzk4NTA2IC43MDkzNC0uMTk5MjUzIC43MDkzNC0uMTY3MzcyQy43MDkzNCAuMDE1OTQgLjg2MDc3MiAuMDc5NzAxIC45NjQzODQgLjA3OTcwMUMxLjEwNzg0NiAuMDc5NzAxIDEuMjI3Mzk3LS4wMTU5NCAxLjI4MzE4OC0uMTExNTgyQzEuMzA3MDk4LS4xNTk0MDIgMS4zNzA4NTktLjQzMDM4NiAxLjQxMDcxLS41OTc3NThMMS41OTQwMjItMS4zMDcwOThaJy8+CjxwYXRoIGlkPSdnMC0xMTAnIGQ9J00xLjU5NDAyMi0xLjMwNzA5OEMxLjYxNzkzMy0xLjQyNjY1IDEuNjk3NjM0LTEuNzI5NTE0IDEuNzIxNTQ0LTEuODQ5MDY2QzEuODMzMTI2LTIuMjc5NDUyIDEuODMzMTI2LTIuMjg3NDIyIDIuMDE2NDM4LTIuNTUwNDM2QzIuMjc5NDUyLTIuOTQwOTcxIDIuNjU0MDQ3LTMuMjkxNjU2IDMuMTg4MDQ1LTMuMjkxNjU2QzMuNDc0OTY5LTMuMjkxNjU2IDMuNjQyMzQxLTMuMTI0Mjg0IDMuNjQyMzQxLTIuNzQ5Njg5QzMuNjQyMzQxLTIuMzExMzMzIDMuMzA3NTk3LTEuNDAyNzQgMy4xNTYxNjQtMS4wMTIyMDRDMy4wNTI1NTMtLjc0OTE5MSAzLjA1MjU1My0uNzAxMzcgMy4wNTI1NTMtLjU5Nzc1OEMzLjA1MjU1My0uMTQzNDYyIDMuNDI3MTQ4IC4wNzk3MDEgMy43Njk4NjMgLjA3OTcwMUM0LjU1MDkzNCAuMDc5NzAxIDQuODc3NzA5LTEuMDM2MTE1IDQuODc3NzA5LTEuMTM5NzI2QzQuODc3NzA5LTEuMjE5NDI3IDQuODEzOTQ4LTEuMjQzMzM3IDQuNzU4MTU3LTEuMjQzMzM3QzQuNjYyNTE2LTEuMjQzMzM3IDQuNjQ2NTc1LTEuMTg3NTQ3IDQuNjIyNjY1LTEuMTA3ODQ2QzQuNDMxMzgyLS40NTQyOTYgNC4wOTY2MzgtLjE0MzQ2MiAzLjc5Mzc3My0uMTQzNDYyQzMuNjY2MjUyLS4xNDM0NjIgMy42MDI0OTEtLjIyMzE2MyAzLjYwMjQ5MS0uNDA2NDc2UzMuNjY2MjUyLS43NjUxMzEgMy43NDU5NTMtLjk2NDM4NEMzLjg2NTUwNC0xLjI2NzI0OCA0LjIxNjE4OS0yLjE4MzgxMSA0LjIxNjE4OS0yLjYzMDEzN0M0LjIxNjE4OS0zLjIyNzg5NSAzLjgwMTc0My0zLjUxNDgxOSAzLjIyNzg5NS0zLjUxNDgxOUMyLjU4MjMxNi0zLjUxNDgxOSAyLjE2Nzg3LTMuMTI0Mjg0IDEuOTM2NzM3LTIuODIxNDJDMS44ODA5NDYtMy4yNTk3NzYgMS41MzAyNjItMy41MTQ4MTkgMS4xMjM3ODYtMy41MTQ4MTlDLjgzNjg2Mi0zLjUxNDgxOSAuNjM3NjA5LTMuMzMxNTA3IC41MTAwODctMy4wODQ0MzNDLjMxODgwNC0yLjcwOTgzOCAuMjM5MTAzLTIuMzExMzMzIC4yMzkxMDMtMi4yOTUzOTJDLjIzOTEwMy0yLjIyMzY2MSAuMjk0ODk0LTIuMTkxNzgxIC4zNTg2NTUtMi4xOTE3ODFDLjQ2MjI2Ny0yLjE5MTc4MSAuNDcwMjM3LTIuMjIzNjYxIC41MjYwMjctMi40MzA4ODRDLjYyMTY2OS0yLjgyMTQyIC43NjUxMzEtMy4yOTE2NTYgMS4wOTk4NzUtMy4yOTE2NTZDMS4zMDcwOTgtMy4yOTE2NTYgMS4zNTQ5MTktMy4wOTI0MDMgMS4zNTQ5MTktMi45MTcwNjFDMS4zNTQ5MTktMi43NzM1OTkgMS4zMTUwNjgtMi42MjIxNjcgMS4yNTEzMDgtMi4zNTkxNTNDMS4yMzUzNjctMi4yOTUzOTIgMS4xMTU4MTYtMS44MjUxNTYgMS4wODM5MzUtMS43MTM1NzRMLjc4OTA0MS0uNTE4MDU3Qy43NTcxNjEtLjM5ODUwNiAuNzA5MzQtLjE5OTI1MyAuNzA5MzQtLjE2NzM3MkMuNzA5MzQgLjAxNTk0IC44NjA3NzIgLjA3OTcwMSAuOTY0Mzg0IC4wNzk3MDFDMS4xMDc4NDYgLjA3OTcwMSAxLjIyNzM5Ny0uMDE1OTQgMS4yODMxODgtLjExMTU4MkMxLjMwNzA5OC0uMTU5NDAyIDEuMzcwODU5LS40MzAzODYgMS40MTA3MS0uNTk3NzU4TDEuNTk0MDIyLTEuMzA3MDk4WicvPgo8cGF0aCBpZD0nZzAtMTIwJyBkPSdNMy45OTMwMjYtMy4xODAwNzVDMy42NDIzNDEtMy4wOTI0MDMgMy42MjY0MDEtMi43ODE1NjkgMy42MjY0MDEtMi43NDk2ODlDMy42MjY0MDEtMi41NzQzNDYgMy43NjE4OTMtMi40NTQ3OTUgMy45MzcyMzUtMi40NTQ3OTVTNC4zODM1NjItMi41OTAyODYgNC4zODM1NjItMi45MzMwMDFDNC4zODM1NjItMy4zODcyOTggMy44ODE0NDUtMy41MTQ4MTkgMy41ODY1NS0zLjUxNDgxOUMzLjIxMTk1NS0zLjUxNDgxOSAyLjkwOTA5MS0zLjI1MTgwNiAyLjcyNTc3OC0yLjk0MDk3MUMyLjU1MDQzNi0zLjM2MzM4NyAyLjEzNTk5LTMuNTE0ODE5IDEuODA5MjE1LTMuNTE0ODE5Qy45NDA0NzMtMy41MTQ4MTkgLjQ1NDI5Ni0yLjUxODU1NSAuNDU0Mjk2LTIuMjk1MzkyQy40NTQyOTYtMi4yMjM2NjEgLjUxMDA4Ny0yLjE5MTc4MSAuNTczODQ4LTIuMTkxNzgxQy42Njk0ODktMi4xOTE3ODEgLjY4NTQzLTIuMjMxNjMxIC43MDkzNC0yLjMyNzI3M0MuODkyNjUzLTIuOTA5MDkxIDEuMzcwODU5LTMuMjkxNjU2IDEuNzg1MzA1LTMuMjkxNjU2QzIuMDk2MTM5LTMuMjkxNjU2IDIuMjQ3NTcyLTMuMDY4NDkzIDIuMjQ3NTcyLTIuNzgxNTY5QzIuMjQ3NTcyLTIuNjIyMTY3IDIuMTUxOTMtMi4yNTU1NDIgMi4wODgxNjktMi4wMDA0OThDMi4wMzIzNzktMS43NjkzNjUgMS44NTcwMzYtMS4wNjAwMjUgMS44MTcxODYtLjkwODU5M0MxLjcwNTYwNC0uNDc4MjA3IDEuNDE4NjgtLjE0MzQ2MiAxLjA2MDAyNS0uMTQzNDYyQzEuMDI4MTQ0LS4xNDM0NjIgLjgyMDkyMi0uMTQzNDYyIC42NTM1NDktLjI1NTA0NEMxLjAyMDE3NC0uMzQyNzE1IDEuMDIwMTc0LS42Nzc0NiAxLjAyMDE3NC0uNjg1NDNDMS4wMjAxNzQtLjg2ODc0MiAuODc2NzEyLS45ODAzMjQgLjcwMTM3LS45ODAzMjRDLjQ4NjE3Ny0uOTgwMzI0IC4yNTUwNDQtLjc5NzAxMSAuMjU1MDQ0LS40OTQxNDdDLjI1NTA0NC0uMTI3NTIyIC42NDU1NzkgLjA3OTcwMSAxLjA1MjA1NSAuMDc5NzAxQzEuNDc0NDcxIC4wNzk3MDEgMS43NjkzNjUtLjIzOTEwMyAxLjkxMjgyNy0uNDk0MTQ3QzIuMDg4MTY5LS4xMDM2MTEgMi40NTQ3OTUgLjA3OTcwMSAyLjgzNzM2IC4wNzk3MDFDMy43MDYxMDIgLjA3OTcwMSA0LjE4NDMwOS0uOTE2NTYzIDQuMTg0MzA5LTEuMTM5NzI2QzQuMTg0MzA5LTEuMjE5NDI3IDQuMTIwNTQ4LTEuMjQzMzM3IDQuMDY0NzU3LTEuMjQzMzM3QzMuOTY5MTE2LTEuMjQzMzM3IDMuOTUzMTc2LTEuMTg3NTQ3IDMuOTI5MjY1LTEuMTA3ODQ2QzMuNzY5ODYzLS41NzM4NDggMy4zMTU1NjctLjE0MzQ2MiAyLjg1MzMtLjE0MzQ2MkMyLjU5MDI4Ni0uMTQzNDYyIDIuMzk5MDA0LS4zMTg4MDQgMi4zOTkwMDQtLjY1MzU0OUMyLjM5OTAwNC0uODEyOTUxIDIuNDQ2ODI0LS45OTYyNjQgMi41NTg0MDYtMS40NDI1OUMyLjYxNDE5Ny0xLjY4MTY5NCAyLjc4OTUzOS0yLjM4MzA2NCAyLjgyOTM5LTIuNTM0NDk2QzIuOTQwOTcxLTIuOTQ4OTQxIDMuMjE5OTI1LTMuMjkxNjU2IDMuNTc4NTgtMy4yOTE2NTZDMy42MTg0MzEtMy4yOTE2NTYgMy44MjU2NTQtMy4yOTE2NTYgMy45OTMwMjYtMy4xODAwNzVaJy8+CjxwYXRoIGlkPSdnMS01OScgZD0nTTIuMzMxMjU4IC4wNDc4MjFDMi4zMzEyNTgtLjY0NTU3OSAyLjEwNDExLTEuMTU5NjUxIDEuNjEzOTQ4LTEuMTU5NjUxQzEuMjMxMzgyLTEuMTU5NjUxIDEuMDQwMS0uODQ4ODE3IDEuMDQwMS0uNTg1ODAzUzEuMjE5NDI3IDAgMS42MjU5MDMgMEMxLjc4MTMyIDAgMS45MTI4MjctLjA0NzgyMSAyLjAyMDQyMy0uMTU1NDE3QzIuMDQ0MzM0LS4xNzkzMjggMi4wNTYyODktLjE3OTMyOCAyLjA2ODI0NC0uMTc5MzI4QzIuMDkyMTU0LS4xNzkzMjggMi4wOTIxNTQtLjAxMTk1NSAyLjA5MjE1NCAuMDQ3ODIxQzIuMDkyMTU0IC40NDIzNDEgMi4wMjA0MjMgMS4yMTk0MjcgMS4zMjcwMjQgMS45OTY1MTNDMS4xOTU1MTcgMi4xMzk5NzUgMS4xOTU1MTcgMi4xNjM4ODUgMS4xOTU1MTcgMi4xODc3OTZDMS4xOTU1MTcgMi4yNDc1NzIgMS4yNTUyOTMgMi4zMDczNDcgMS4zMTUwNjggMi4zMDczNDdDMS40MTA3MSAyLjMwNzM0NyAyLjMzMTI1OCAxLjQyMjY2NSAyLjMzMTI1OCAuMDQ3ODIxWicvPgo8cGF0aCBpZD0nZzEtMTIwJyBkPSdNNS42NjY3NS00Ljg3NzcwOUM1LjI4NDE4NC00LjgwNTk3OCA1LjE0MDcyMi00LjUxOTA1NCA1LjE0MDcyMi00LjI5MTkwNUM1LjE0MDcyMi00LjAwNDk4MSA1LjM2Nzg3LTMuOTA5MzQgNS41MzUyNDMtMy45MDkzNEM1Ljg5Mzg5OC0zLjkwOTM0IDYuMTQ0OTU2LTQuMjIwMTc0IDYuMTQ0OTU2LTQuNTQyOTY0QzYuMTQ0OTU2LTUuMDQ1MDgxIDUuNTcxMTA4LTUuMjcyMjI5IDUuMDY4OTkxLTUuMjcyMjI5QzQuMzM5NzI2LTUuMjcyMjI5IDMuOTMzMjUtNC41NTQ5MTkgMy44MjU2NTQtNC4zMjc3NzFDMy41NTA2ODUtNS4yMjQ0MDggMi44MDk0NjUtNS4yNzIyMjkgMi41OTQyNzEtNS4yNzIyMjlDMS4zNzQ4NDQtNS4yNzIyMjkgLjcyOTI2NS0zLjcwNjEwMiAuNzI5MjY1LTMuNDQzMDg4Qy43MjkyNjUtMy4zOTUyNjggLjc3NzA4Ni0zLjMzNTQ5MiAuODYwNzcyLTMuMzM1NDkyQy45NTY0MTMtMy4zMzU0OTIgLjk4MDMyNC0zLjQwNzIyMyAxLjAwNDIzNC0zLjQ1NTA0NEMxLjQxMDcxLTQuNzgyMDY3IDIuMjExNzA2LTUuMDMzMTI2IDIuNTU4NDA2LTUuMDMzMTI2QzMuMDk2Mzg5LTUuMDMzMTI2IDMuMjAzOTg1LTQuNTMxMDA5IDMuMjAzOTg1LTQuMjQ0MDg1QzMuMjAzOTg1LTMuOTgxMDcxIDMuMTMyMjU0LTMuNzA2MTAyIDIuOTg4NzkyLTMuMTMyMjU0TDIuNTgyMzE2LTEuNDk0Mzk2QzIuNDAyOTg5LS43NzcwODYgMi4wNTYyODktLjExOTU1MiAxLjQyMjY2NS0uMTE5NTUyQzEuMzYyODg5LS4xMTk1NTIgMS4wNjQwMS0uMTE5NTUyIC44MTI5NTEtLjI3NDk2OUMxLjI0MzMzNy0uMzU4NjU1IDEuMzM4OTc5LS43MTczMSAxLjMzODk3OS0uODYwNzcyQzEuMzM4OTc5LTEuMDk5ODc1IDEuMTU5NjUxLTEuMjQzMzM3IC45MzI1MDMtMS4yNDMzMzdDLjY0NTU3OS0xLjI0MzMzNyAuMzM0NzQ1LS45OTIyNzkgLjMzNDc0NS0uNjA5NzE0Qy4zMzQ3NDUtLjEwNzU5NyAuODk2NjM4IC4xMTk1NTIgMS40MTA3MSAuMTE5NTUyQzEuOTg0NTU4IC4xMTk1NTIgMi4zOTEwMzQtLjMzNDc0NSAyLjY0MjA5Mi0uODI0OTA3QzIuODMzMzc1LS4xMTk1NTIgMy40MzExMzMgLjExOTU1MiAzLjg3MzQ3NCAuMTE5NTUyQzUuMDkyOTAyIC4xMTk1NTIgNS43Mzg0ODEtMS40NDY1NzUgNS43Mzg0ODEtMS43MDk1ODlDNS43Mzg0ODEtMS43NjkzNjUgNS42OTA2Ni0xLjgxNzE4NiA1LjYxODkyOS0xLjgxNzE4NkM1LjUxMTMzMy0xLjgxNzE4NiA1LjQ5OTM3Ny0xLjc1NzQxIDUuNDYzNTEyLTEuNjYxNzY4QzUuMTQwNzIyLS42MDk3MTQgNC40NDczMjMtLjExOTU1MiAzLjkwOTM0LS4xMTk1NTJDMy40OTA5MDktLjExOTU1MiAzLjI2Mzc2MS0uNDMwMzg2IDMuMjYzNzYxLS45MjA1NDhDMy4yNjM3NjEtMS4xODM1NjIgMy4zMTE1ODItMS4zNzQ4NDQgMy41MDI4NjQtMi4xNjM4ODVMMy45MjEyOTUtMy43ODk3ODhDNC4xMDA2MjMtNC41MDcwOTggNC41MDcwOTgtNS4wMzMxMjYgNS4wNTcwMzYtNS4wMzMxMjZDNS4wODA5NDYtNS4wMzMxMjYgNS40MTU2OTEtNS4wMzMxMjYgNS42NjY3NS00Ljg3NzcwOVonLz4KPHBhdGggaWQ9J2cyLTkxJyBkPSdNMi45ODg3OTIgMi45ODg3OTJWMi41NDY0NTFIMS44MjkxNDFWLTguNTI0MDM1SDIuOTg4NzkyVi04Ljk2NjM3NkgxLjM4NjhWMi45ODg3OTJIMi45ODg3OTJaJy8+CjxwYXRoIGlkPSdnMi05MycgZD0nTTEuODUzMDUxLTguOTY2Mzc2SC4yNTEwNTlWLTguNTI0MDM1SDEuNDEwNzFWMi41NDY0NTFILjI1MTA1OVYyLjk4ODc5MkgxLjg1MzA1MVYtOC45NjYzNzZaJy8+CjwvZGVmcz4KPGcgaWQ9J3BhZ2UxJz4KPHVzZSB4PScwJyB5PScwJyB4bGluazpocmVmPScjZzItOTEnLz4KPHVzZSB4PSczLjI1MTY2MScgeT0nMCcgeGxpbms6aHJlZj0nI2cxLTEyMCcvPgo8dXNlIHg9JzkuOTAzNzQ4JyB5PSctNC4zMzg0MzcnIHhsaW5rOmhyZWY9JyNnMC0xMDknLz4KPHVzZSB4PScxNy4zOTQyNzUnIHk9Jy00LjMzODQzNycgeGxpbms6aHJlZj0nI2cwLTEwNScvPgo8dXNlIHg9JzIwLjI3NzQxNCcgeT0nLTQuMzM4NDM3JyB4bGluazpocmVmPScjZzAtMTEwJy8+Cjx1c2UgeD0nOS45MDM3NDgnIHk9JzIuOTU1NTE1JyB4bGluazpocmVmPScjZzAtMTA1Jy8+Cjx1c2UgeD0nMjUuOTEzNzQ5JyB5PScwJyB4bGluazpocmVmPScjZzEtNTknLz4KPHVzZSB4PSczMS4xNTc5MDgnIHk9JzAnIHhsaW5rOmhyZWY9JyNnMS0xMjAnLz4KPHVzZSB4PSczNy44MDk5OTUnIHk9Jy00LjMzODQzNycgeGxpbms6aHJlZj0nI2cwLTEwOScvPgo8dXNlIHg9JzQ1LjMwMDUyMScgeT0nLTQuMzM4NDM3JyB4bGluazpocmVmPScjZzAtOTcnLz4KPHVzZSB4PSc0OS43OTg1MzEnIHk9Jy00LjMzODQzNycgeGxpbms6aHJlZj0nI2cwLTEyMCcvPgo8dXNlIHg9JzM3LjgwOTk5NScgeT0nMi45NTU1MTUnIHhsaW5rOmhyZWY9JyNnMC0xMDUnLz4KPHVzZSB4PSc1NS4wNjM1NjInIHk9JzAnIHhsaW5rOmhyZWY9JyNnMi05MycvPgo8L2c+Cjwvc3ZnPgo8IS0tIERFUFRIPTQgLS0+) , when all the other components of
, when all the other components of
 are fixed to the corresponding components of the centralPoint
  .
Then OpenTURNS draws the graph:
.
Then OpenTURNS draws the graph:
for any
![s \in [x_i^{min}, x_i^{max}]](data:image/svg+xml;base64,PD94bWwgdmVyc2lvbj0nMS4wJyBlbmNvZGluZz0nVVRGLTgnPz4KPCEtLSBUaGlzIGZpbGUgd2FzIGdlbmVyYXRlZCBieSBkdmlzdmdtIDMuNC4yIC0tPgo8c3ZnIHZlcnNpb249JzEuMScgeG1sbnM9J2h0dHA6Ly93d3cudzMub3JnLzIwMDAvc3ZnJyB4bWxuczp4bGluaz0naHR0cDovL3d3dy53My5vcmcvMTk5OS94bGluaycgd2lkdGg9Jzc4LjQ0MTAyNnB0JyBoZWlnaHQ9JzEyLjU5NjE2NnB0JyB2aWV3Qm94PScwIC05LjYwNzM3NCA3OC40NDEwMjYgMTIuNTk2MTY2Jz4KPGRlZnM+CjxwYXRoIGlkPSdnMS05NycgZD0nTTMuMTI0Mjg0LTMuMDM2NjEzQzMuMDUyNTUzLTMuMTcyMTA1IDIuODIxNDItMy41MTQ4MTkgMi4zMzUyNDMtMy41MTQ4MTlDMS4zODY4LTMuNTE0ODE5IC4zNDI3MTUtMi40MDY5NzQgLjM0MjcxNS0xLjIyNzM5N0MuMzQyNzE1LS4zOTg1MDYgLjg3NjcxMiAuMDc5NzAxIDEuNDkwNDExIC4wNzk3MDFDMi4wMDA0OTggLjA3OTcwMSAyLjQzODg1NC0uMzI2Nzc1IDIuNTgyMzE2LS40ODYxNzdDMi43MjU3NzggLjA2Mzc2MSAzLjI2Nzc0NiAuMDc5NzAxIDMuMzYzMzg3IC4wNzk3MDFDMy43MzAwMTIgLjA3OTcwMSAzLjkxMzMyNS0uMjIzMTYzIDMuOTc3MDg2LS4zNTg2NTVDNC4xMzY0ODgtLjY0NTU3OSA0LjI0ODA3LTEuMTA3ODQ2IDQuMjQ4MDctMS4xMzk3MjZDNC4yNDgwNy0xLjE4NzU0NyA0LjIxNjE4OS0xLjI0MzMzNyA0LjEyMDU0OC0xLjI0MzMzN1M0LjAwODk2Ni0xLjE5NTUxNyAzLjk2MTE0Ni0uOTk2MjY0QzMuODQ5NTY0LS41NTc5MDggMy42OTgxMzItLjE0MzQ2MiAzLjM4NzI5OC0uMTQzNDYyQzMuMjAzOTg1LS4xNDM0NjIgMy4xMzIyNTQtLjI5NDg5NCAzLjEzMjI1NC0uNTE4MDU3QzMuMTMyMjU0LS42NTM1NDkgMy4yMDM5ODUtLjkyNDUzMyAzLjI1MTgwNi0xLjEyMzc4NlMzLjQxOTE3OC0xLjgwMTI0NSAzLjQ1MTA1OS0xLjk0NDcwN0wzLjYxMDQ2MS0yLjU1MDQzNkMzLjY1MDMxMS0yLjc0MTcxOSAzLjczNzk4My0zLjA3NjQ2MyAzLjczNzk4My0zLjExNjMxNEMzLjczNzk4My0zLjI5OTYyNiAzLjU4NjU1LTMuMzYzMzg3IDMuNDgyOTM5LTMuMzYzMzg3QzMuMzYzMzg3LTMuMzYzMzg3IDMuMTY0MTM0LTMuMjgzNjg2IDMuMTI0Mjg0LTMuMDM2NjEzWk0yLjU4MjMxNi0uODYwNzcyQzIuMTgzODExLS4zMTA4MzQgMS43NjkzNjUtLjE0MzQ2MiAxLjUxNDMyMS0uMTQzNDYyQzEuMTQ3Njk2LS4xNDM0NjIgLjk2NDM4NC0uNDc4MjA3IC45NjQzODQtLjg5MjY1M0MuOTY0Mzg0LTEuMjY3MjQ4IDEuMTc5NTc3LTIuMTIwMDUgMS4zNTQ5MTktMi40NzA3MzVDMS41ODYwNTItMi45NTY5MTIgMS45NzY1ODgtMy4yOTE2NTYgMi4zNDMyMTMtMy4yOTE2NTZDMi44NjEyNy0zLjI5MTY1NiAzLjAxMjcwMi0yLjcwOTgzOCAzLjAxMjcwMi0yLjYxNDE5N0MzLjAxMjcwMi0yLjU4MjMxNiAyLjgxMzQ1LTEuODAxMjQ1IDIuNzY1NjI5LTEuNTk0MDIyQzIuNjYyMDE3LTEuMjE5NDI3IDIuNjYyMDE3LTEuMjAzNDg3IDIuNTgyMzE2LS44NjA3NzJaJy8+CjxwYXRoIGlkPSdnMS0xMDUnIGQ9J00yLjM3NTA5My00Ljk3MzM1QzIuMzc1MDkzLTUuMTQ4NjkyIDIuMjQ3NTcyLTUuMjc2MjE0IDIuMDY0MjU5LTUuMjc2MjE0QzEuODU3MDM2LTUuMjc2MjE0IDEuNjI1OTAzLTUuMDg0OTMyIDEuNjI1OTAzLTQuODQ1ODI4QzEuNjI1OTAzLTQuNjcwNDg2IDEuNzUzNDI1LTQuNTQyOTY0IDEuOTM2NzM3LTQuNTQyOTY0QzIuMTQzOTYtNC41NDI5NjQgMi4zNzUwOTMtNC43MzQyNDcgMi4zNzUwOTMtNC45NzMzNVpNMS4yMTE0NTctMi4wNDgzMTlMLjc4MTA3MS0uOTQ4NDQzQy43NDEyMi0uODI4ODkyIC43MDEzNy0uNzMzMjUgLjcwMTM3LS41OTc3NThDLjcwMTM3LS4yMDcyMjMgMS4wMDQyMzQgLjA3OTcwMSAxLjQyNjY1IC4wNzk3MDFDMi4xOTk3NTEgLjA3OTcwMSAyLjUyNjUyNi0xLjAzNjExNSAyLjUyNjUyNi0xLjEzOTcyNkMyLjUyNjUyNi0xLjIxOTQyNyAyLjQ2Mjc2NS0xLjI0MzMzNyAyLjQwNjk3NC0xLjI0MzMzN0MyLjMxMTMzMy0xLjI0MzMzNyAyLjI5NTM5Mi0xLjE4NzU0NyAyLjI3MTQ4Mi0xLjEwNzg0NkMyLjA4ODE2OS0uNDcwMjM3IDEuNzYxMzk1LS4xNDM0NjIgMS40NDI1OS0uMTQzNDYyQzEuMzQ2OTQ5LS4xNDM0NjIgMS4yNTEzMDgtLjE4MzMxMyAxLjI1MTMwOC0uMzk4NTA2QzEuMjUxMzA4LS41ODk3ODggMS4zMDcwOTgtLjczMzI1IDEuNDEwNzEtLjk4MDMyNEMxLjQ5MDQxMS0xLjE5NTUxNyAxLjU3MDExMi0xLjQxMDcxIDEuNjU3NzgzLTEuNjI1OTAzTDEuOTA0ODU3LTIuMjcxNDgyQzEuOTc2NTg4LTIuNDU0Nzk1IDIuMDcyMjI5LTIuNzAxODY4IDIuMDcyMjI5LTIuODM3MzZDMi4wNzIyMjktMy4yMzU4NjYgMS43NTM0MjUtMy41MTQ4MTkgMS4zNDY5NDktMy41MTQ4MTlDLjU3Mzg0OC0zLjUxNDgxOSAuMjM5MTAzLTIuMzk5MDA0IC4yMzkxMDMtMi4yOTUzOTJDLjIzOTEwMy0yLjIyMzY2MSAuMjk0ODk0LTIuMTkxNzgxIC4zNTg2NTUtMi4xOTE3ODFDLjQ2MjI2Ny0yLjE5MTc4MSAuNDcwMjM3LTIuMjM5NjAxIC40OTQxNDctMi4zMTkzMDNDLjcxNzMxLTMuMDc2NDYzIDEuMDgzOTM1LTMuMjkxNjU2IDEuMzIzMDM5LTMuMjkxNjU2QzEuNDM0NjItMy4yOTE2NTYgMS41MTQzMjEtMy4yNTE4MDYgMS41MTQzMjEtMy4wMjg2NDNDMS41MTQzMjEtMi45NDg5NDEgMS41MDYzNTEtMi44MzczNiAxLjQyNjY1LTIuNTk4MjU3TDEuMjExNDU3LTIuMDQ4MzE5WicvPgo8cGF0aCBpZD0nZzEtMTA5JyBkPSdNMS41OTQwMjItMS4zMDcwOThDMS42MTc5MzMtMS40MjY2NSAxLjY5NzYzNC0xLjcyOTUxNCAxLjcyMTU0NC0xLjg0OTA2NkMxLjc0NTQ1NS0xLjkyODc2NyAxLjc5MzI3NS0yLjEyMDA1IDEuODA5MjE1LTIuMTk5NzUxQzEuODI1MTU2LTIuMjM5NjAxIDIuMDg4MTY5LTIuNzU3NjU5IDIuNDM4ODU0LTMuMDIwNjcyQzIuNzA5ODM4LTMuMjI3ODk1IDIuOTcyODUyLTMuMjkxNjU2IDMuMTk2MDE1LTMuMjkxNjU2QzMuNDkwOTA5LTMuMjkxNjU2IDMuNjUwMzExLTMuMTE2MzE0IDMuNjUwMzExLTIuNzQ5Njg5QzMuNjUwMzExLTIuNTU4NDA2IDMuNjAyNDkxLTIuMzc1MDkzIDMuNTE0ODE5LTIuMDE2NDM4QzMuNDU5MDI5LTEuODA5MjE1IDMuMzIzNTM3LTEuMjc1MjE4IDMuMjc1NzE2LTEuMDYwMDI1TDMuMTU2MTY0LS41ODE4MThDMy4xMTYzMTQtLjQ0NjMyNiAzLjA2MDUyMy0uMjA3MjIzIDMuMDYwNTIzLS4xNjczNzJDMy4wNjA1MjMgLjAxNTk0IDMuMjExOTU1IC4wNzk3MDEgMy4zMTU1NjcgLjA3OTcwMUMzLjQ1OTAyOSAuMDc5NzAxIDMuNTc4NTgtLjAxNTk0IDMuNjM0MzcxLS4xMTE1ODJDMy42NTgyODEtLjE1OTQwMiAzLjcyMjA0Mi0uNDMwMzg2IDMuNzYxODkzLS41OTc3NThMMy45NDUyMDUtMS4zMDcwOThDMy45NjkxMTYtMS40MjY2NSA0LjA0ODgxNy0xLjcyOTUxNCA0LjA3MjcyNy0xLjg0OTA2NkM0LjE4NDMwOS0yLjI3OTQ1MiA0LjE4NDMwOS0yLjI4NzQyMiA0LjM2NzYyMS0yLjU1MDQzNkM0LjYzMDYzNS0yLjk0MDk3MSA1LjAwNTIzLTMuMjkxNjU2IDUuNTM5MjI4LTMuMjkxNjU2QzUuODI2MTUyLTMuMjkxNjU2IDUuOTkzNTI0LTMuMTI0Mjg0IDUuOTkzNTI0LTIuNzQ5Njg5QzUuOTkzNTI0LTIuMzExMzMzIDUuNjU4NzgtMS4zOTQ3NyA1LjUwNzM0Ny0xLjAxMjIwNEM1LjQyNzY0Ni0uODA0OTgxIDUuNDAzNzM2LS43NDkxOTEgNS40MDM3MzYtLjU5Nzc1OEM1LjQwMzczNi0uMTQzNDYyIDUuNzc4MzMxIC4wNzk3MDEgNi4xMjEwNDYgLjA3OTcwMUM2LjkwMjExNyAuMDc5NzAxIDcuMjI4ODkyLTEuMDM2MTE1IDcuMjI4ODkyLTEuMTM5NzI2QzcuMjI4ODkyLTEuMjE5NDI3IDcuMTY1MTMxLTEuMjQzMzM3IDcuMTA5MzQtMS4yNDMzMzdDNy4wMTM2OTktMS4yNDMzMzcgNi45OTc3NTgtMS4xODc1NDcgNi45NzM4NDgtMS4xMDc4NDZDNi43ODI1NjUtLjQ0NjMyNiA2LjQ0NzgyMS0uMTQzNDYyIDYuMTQ0OTU2LS4xNDM0NjJDNi4wMTc0MzUtLjE0MzQ2MiA1Ljk1MzY3NC0uMjIzMTYzIDUuOTUzNjc0LS40MDY0NzZTNi4wMTc0MzUtLjc2NTEzMSA2LjA5NzEzNi0uOTY0Mzg0QzYuMjE2Njg3LTEuMjY3MjQ4IDYuNTY3MzcyLTIuMTgzODExIDYuNTY3MzcyLTIuNjMwMTM3QzYuNTY3MzcyLTMuMjI3ODk1IDYuMTUyOTI3LTMuNTE0ODE5IDUuNTc5MDc4LTMuNTE0ODE5QzUuMDI5MTQxLTMuNTE0ODE5IDQuNTc0ODQ0LTMuMjI3ODk1IDQuMjE2MTg5LTIuNzMzNzQ4QzQuMTUyNDI4LTMuMzcxMzU3IDMuNjQyMzQxLTMuNTE0ODE5IDMuMjI3ODk1LTMuNTE0ODE5QzIuODYxMjctMy41MTQ4MTkgMi4zNzUwOTMtMy4zODcyOTggMS45MzY3MzctMi44MTM0NUMxLjg4MDk0Ni0zLjI5MTY1NiAxLjQ5ODM4MS0zLjUxNDgxOSAxLjEyMzc4Ni0zLjUxNDgxOUMuODQ0ODMyLTMuNTE0ODE5IC42NDU1NzktMy4zNDc0NDcgLjUxMDA4Ny0zLjA3NjQ2M0MuMzE4ODA0LTIuNzAxODY4IC4yMzkxMDMtMi4zMTEzMzMgLjIzOTEwMy0yLjI5NTM5MkMuMjM5MTAzLTIuMjIzNjYxIC4yOTQ4OTQtMi4xOTE3ODEgLjM1ODY1NS0yLjE5MTc4MUMuNDYyMjY3LTIuMTkxNzgxIC40NzAyMzctMi4yMjM2NjEgLjUyNjAyNy0yLjQzMDg4NEMuNjIxNjY5LTIuODIxNDIgLjc2NTEzMS0zLjI5MTY1NiAxLjA5OTg3NS0zLjI5MTY1NkMxLjMwNzA5OC0zLjI5MTY1NiAxLjM1NDkxOS0zLjA5MjQwMyAxLjM1NDkxOS0yLjkxNzA2MUMxLjM1NDkxOS0yLjc3MzU5OSAxLjMxNTA2OC0yLjYyMjE2NyAxLjI1MTMwOC0yLjM1OTE1M0MxLjIzNTM2Ny0yLjI5NTM5MiAxLjExNTgxNi0xLjgyNTE1NiAxLjA4MzkzNS0xLjcxMzU3NEwuNzg5MDQxLS41MTgwNTdDLjc1NzE2MS0uMzk4NTA2IC43MDkzNC0uMTk5MjUzIC43MDkzNC0uMTY3MzcyQy43MDkzNCAuMDE1OTQgLjg2MDc3MiAuMDc5NzAxIC45NjQzODQgLjA3OTcwMUMxLjEwNzg0NiAuMDc5NzAxIDEuMjI3Mzk3LS4wMTU5NCAxLjI4MzE4OC0uMTExNTgyQzEuMzA3MDk4LS4xNTk0MDIgMS4zNzA4NTktLjQzMDM4NiAxLjQxMDcxLS41OTc3NThMMS41OTQwMjItMS4zMDcwOThaJy8+CjxwYXRoIGlkPSdnMS0xMTAnIGQ9J00xLjU5NDAyMi0xLjMwNzA5OEMxLjYxNzkzMy0xLjQyNjY1IDEuNjk3NjM0LTEuNzI5NTE0IDEuNzIxNTQ0LTEuODQ5MDY2QzEuODMzMTI2LTIuMjc5NDUyIDEuODMzMTI2LTIuMjg3NDIyIDIuMDE2NDM4LTIuNTUwNDM2QzIuMjc5NDUyLTIuOTQwOTcxIDIuNjU0MDQ3LTMuMjkxNjU2IDMuMTg4MDQ1LTMuMjkxNjU2QzMuNDc0OTY5LTMuMjkxNjU2IDMuNjQyMzQxLTMuMTI0Mjg0IDMuNjQyMzQxLTIuNzQ5Njg5QzMuNjQyMzQxLTIuMzExMzMzIDMuMzA3NTk3LTEuNDAyNzQgMy4xNTYxNjQtMS4wMTIyMDRDMy4wNTI1NTMtLjc0OTE5MSAzLjA1MjU1My0uNzAxMzcgMy4wNTI1NTMtLjU5Nzc1OEMzLjA1MjU1My0uMTQzNDYyIDMuNDI3MTQ4IC4wNzk3MDEgMy43Njk4NjMgLjA3OTcwMUM0LjU1MDkzNCAuMDc5NzAxIDQuODc3NzA5LTEuMDM2MTE1IDQuODc3NzA5LTEuMTM5NzI2QzQuODc3NzA5LTEuMjE5NDI3IDQuODEzOTQ4LTEuMjQzMzM3IDQuNzU4MTU3LTEuMjQzMzM3QzQuNjYyNTE2LTEuMjQzMzM3IDQuNjQ2NTc1LTEuMTg3NTQ3IDQuNjIyNjY1LTEuMTA3ODQ2QzQuNDMxMzgyLS40NTQyOTYgNC4wOTY2MzgtLjE0MzQ2MiAzLjc5Mzc3My0uMTQzNDYyQzMuNjY2MjUyLS4xNDM0NjIgMy42MDI0OTEtLjIyMzE2MyAzLjYwMjQ5MS0uNDA2NDc2UzMuNjY2MjUyLS43NjUxMzEgMy43NDU5NTMtLjk2NDM4NEMzLjg2NTUwNC0xLjI2NzI0OCA0LjIxNjE4OS0yLjE4MzgxMSA0LjIxNjE4OS0yLjYzMDEzN0M0LjIxNjE4OS0zLjIyNzg5NSAzLjgwMTc0My0zLjUxNDgxOSAzLjIyNzg5NS0zLjUxNDgxOUMyLjU4MjMxNi0zLjUxNDgxOSAyLjE2Nzg3LTMuMTI0Mjg0IDEuOTM2NzM3LTIuODIxNDJDMS44ODA5NDYtMy4yNTk3NzYgMS41MzAyNjItMy41MTQ4MTkgMS4xMjM3ODYtMy41MTQ4MTlDLjgzNjg2Mi0zLjUxNDgxOSAuNjM3NjA5LTMuMzMxNTA3IC41MTAwODctMy4wODQ0MzNDLjMxODgwNC0yLjcwOTgzOCAuMjM5MTAzLTIuMzExMzMzIC4yMzkxMDMtMi4yOTUzOTJDLjIzOTEwMy0yLjIyMzY2MSAuMjk0ODk0LTIuMTkxNzgxIC4zNTg2NTUtMi4xOTE3ODFDLjQ2MjI2Ny0yLjE5MTc4MSAuNDcwMjM3LTIuMjIzNjYxIC41MjYwMjctMi40MzA4ODRDLjYyMTY2OS0yLjgyMTQyIC43NjUxMzEtMy4yOTE2NTYgMS4wOTk4NzUtMy4yOTE2NTZDMS4zMDcwOTgtMy4yOTE2NTYgMS4zNTQ5MTktMy4wOTI0MDMgMS4zNTQ5MTktMi45MTcwNjFDMS4zNTQ5MTktMi43NzM1OTkgMS4zMTUwNjgtMi42MjIxNjcgMS4yNTEzMDgtMi4zNTkxNTNDMS4yMzUzNjctMi4yOTUzOTIgMS4xMTU4MTYtMS44MjUxNTYgMS4wODM5MzUtMS43MTM1NzRMLjc4OTA0MS0uNTE4MDU3Qy43NTcxNjEtLjM5ODUwNiAuNzA5MzQtLjE5OTI1MyAuNzA5MzQtLjE2NzM3MkMuNzA5MzQgLjAxNTk0IC44NjA3NzIgLjA3OTcwMSAuOTY0Mzg0IC4wNzk3MDFDMS4xMDc4NDYgLjA3OTcwMSAxLjIyNzM5Ny0uMDE1OTQgMS4yODMxODgtLjExMTU4MkMxLjMwNzA5OC0uMTU5NDAyIDEuMzcwODU5LS40MzAzODYgMS40MTA3MS0uNTk3NzU4TDEuNTk0MDIyLTEuMzA3MDk4WicvPgo8cGF0aCBpZD0nZzEtMTIwJyBkPSdNMy45OTMwMjYtMy4xODAwNzVDMy42NDIzNDEtMy4wOTI0MDMgMy42MjY0MDEtMi43ODE1NjkgMy42MjY0MDEtMi43NDk2ODlDMy42MjY0MDEtMi41NzQzNDYgMy43NjE4OTMtMi40NTQ3OTUgMy45MzcyMzUtMi40NTQ3OTVTNC4zODM1NjItMi41OTAyODYgNC4zODM1NjItMi45MzMwMDFDNC4zODM1NjItMy4zODcyOTggMy44ODE0NDUtMy41MTQ4MTkgMy41ODY1NS0zLjUxNDgxOUMzLjIxMTk1NS0zLjUxNDgxOSAyLjkwOTA5MS0zLjI1MTgwNiAyLjcyNTc3OC0yLjk0MDk3MUMyLjU1MDQzNi0zLjM2MzM4NyAyLjEzNTk5LTMuNTE0ODE5IDEuODA5MjE1LTMuNTE0ODE5Qy45NDA0NzMtMy41MTQ4MTkgLjQ1NDI5Ni0yLjUxODU1NSAuNDU0Mjk2LTIuMjk1MzkyQy40NTQyOTYtMi4yMjM2NjEgLjUxMDA4Ny0yLjE5MTc4MSAuNTczODQ4LTIuMTkxNzgxQy42Njk0ODktMi4xOTE3ODEgLjY4NTQzLTIuMjMxNjMxIC43MDkzNC0yLjMyNzI3M0MuODkyNjUzLTIuOTA5MDkxIDEuMzcwODU5LTMuMjkxNjU2IDEuNzg1MzA1LTMuMjkxNjU2QzIuMDk2MTM5LTMuMjkxNjU2IDIuMjQ3NTcyLTMuMDY4NDkzIDIuMjQ3NTcyLTIuNzgxNTY5QzIuMjQ3NTcyLTIuNjIyMTY3IDIuMTUxOTMtMi4yNTU1NDIgMi4wODgxNjktMi4wMDA0OThDMi4wMzIzNzktMS43NjkzNjUgMS44NTcwMzYtMS4wNjAwMjUgMS44MTcxODYtLjkwODU5M0MxLjcwNTYwNC0uNDc4MjA3IDEuNDE4NjgtLjE0MzQ2MiAxLjA2MDAyNS0uMTQzNDYyQzEuMDI4MTQ0LS4xNDM0NjIgLjgyMDkyMi0uMTQzNDYyIC42NTM1NDktLjI1NTA0NEMxLjAyMDE3NC0uMzQyNzE1IDEuMDIwMTc0LS42Nzc0NiAxLjAyMDE3NC0uNjg1NDNDMS4wMjAxNzQtLjg2ODc0MiAuODc2NzEyLS45ODAzMjQgLjcwMTM3LS45ODAzMjRDLjQ4NjE3Ny0uOTgwMzI0IC4yNTUwNDQtLjc5NzAxMSAuMjU1MDQ0LS40OTQxNDdDLjI1NTA0NC0uMTI3NTIyIC42NDU1NzkgLjA3OTcwMSAxLjA1MjA1NSAuMDc5NzAxQzEuNDc0NDcxIC4wNzk3MDEgMS43NjkzNjUtLjIzOTEwMyAxLjkxMjgyNy0uNDk0MTQ3QzIuMDg4MTY5LS4xMDM2MTEgMi40NTQ3OTUgLjA3OTcwMSAyLjgzNzM2IC4wNzk3MDFDMy43MDYxMDIgLjA3OTcwMSA0LjE4NDMwOS0uOTE2NTYzIDQuMTg0MzA5LTEuMTM5NzI2QzQuMTg0MzA5LTEuMjE5NDI3IDQuMTIwNTQ4LTEuMjQzMzM3IDQuMDY0NzU3LTEuMjQzMzM3QzMuOTY5MTE2LTEuMjQzMzM3IDMuOTUzMTc2LTEuMTg3NTQ3IDMuOTI5MjY1LTEuMTA3ODQ2QzMuNzY5ODYzLS41NzM4NDggMy4zMTU1NjctLjE0MzQ2MiAyLjg1MzMtLjE0MzQ2MkMyLjU5MDI4Ni0uMTQzNDYyIDIuMzk5MDA0LS4zMTg4MDQgMi4zOTkwMDQtLjY1MzU0OUMyLjM5OTAwNC0uODEyOTUxIDIuNDQ2ODI0LS45OTYyNjQgMi41NTg0MDYtMS40NDI1OUMyLjYxNDE5Ny0xLjY4MTY5NCAyLjc4OTUzOS0yLjM4MzA2NCAyLjgyOTM5LTIuNTM0NDk2QzIuOTQwOTcxLTIuOTQ4OTQxIDMuMjE5OTI1LTMuMjkxNjU2IDMuNTc4NTgtMy4yOTE2NTZDMy42MTg0MzEtMy4yOTE2NTYgMy44MjU2NTQtMy4yOTE2NTYgMy45OTMwMjYtMy4xODAwNzVaJy8+CjxwYXRoIGlkPSdnMy05MScgZD0nTTIuOTg4NzkyIDIuOTg4NzkyVjIuNTQ2NDUxSDEuODI5MTQxVi04LjUyNDAzNUgyLjk4ODc5MlYtOC45NjYzNzZIMS4zODY4VjIuOTg4NzkySDIuOTg4NzkyWicvPgo8cGF0aCBpZD0nZzMtOTMnIGQ9J00xLjg1MzA1MS04Ljk2NjM3NkguMjUxMDU5Vi04LjUyNDAzNUgxLjQxMDcxVjIuNTQ2NDUxSC4yNTEwNTlWMi45ODg3OTJIMS44NTMwNTFWLTguOTY2Mzc2WicvPgo8cGF0aCBpZD0nZzAtNTAnIGQ9J002LjU1MTQzMi0yLjc0OTY4OUM2Ljc1NDY3LTIuNzQ5Njg5IDYuOTY5ODYzLTIuNzQ5Njg5IDYuOTY5ODYzLTIuOTg4NzkyUzYuNzU0NjctMy4yMjc4OTUgNi41NTE0MzItMy4yMjc4OTVIMS40ODI0NDFDMS42MjU5MDMtNC44Mjk4ODggMy4wMDA3NDctNS45Nzc1ODQgNC42ODY0MjYtNS45Nzc1ODRINi41NTE0MzJDNi43NTQ2Ny01Ljk3NzU4NCA2Ljk2OTg2My01Ljk3NzU4NCA2Ljk2OTg2My02LjIxNjY4N1M2Ljc1NDY3LTYuNDU1NzkxIDYuNTUxNDMyLTYuNDU1NzkxSDQuNjYyNTE2QzIuNjE4MTgyLTYuNDU1NzkxIC45OTIyNzktNC45MDE2MTkgLjk5MjI3OS0yLjk4ODc5MlMyLjYxODE4MiAuNDc4MjA3IDQuNjYyNTE2IC40NzgyMDdINi41NTE0MzJDNi43NTQ2NyAuNDc4MjA3IDYuOTY5ODYzIC40NzgyMDcgNi45Njk4NjMgLjIzOTEwM1M2Ljc1NDY3IDAgNi41NTE0MzIgMEg0LjY4NjQyNkMzLjAwMDc0NyAwIDEuNjI1OTAzLTEuMTQ3Njk2IDEuNDgyNDQxLTIuNzQ5Njg5SDYuNTUxNDMyWicvPgo8cGF0aCBpZD0nZzItNTknIGQ9J00yLjMzMTI1OCAuMDQ3ODIxQzIuMzMxMjU4LS42NDU1NzkgMi4xMDQxMS0xLjE1OTY1MSAxLjYxMzk0OC0xLjE1OTY1MUMxLjIzMTM4Mi0xLjE1OTY1MSAxLjA0MDEtLjg0ODgxNyAxLjA0MDEtLjU4NTgwM1MxLjIxOTQyNyAwIDEuNjI1OTAzIDBDMS43ODEzMiAwIDEuOTEyODI3LS4wNDc4MjEgMi4wMjA0MjMtLjE1NTQxN0MyLjA0NDMzNC0uMTc5MzI4IDIuMDU2Mjg5LS4xNzkzMjggMi4wNjgyNDQtLjE3OTMyOEMyLjA5MjE1NC0uMTc5MzI4IDIuMDkyMTU0LS4wMTE5NTUgMi4wOTIxNTQgLjA0NzgyMUMyLjA5MjE1NCAuNDQyMzQxIDIuMDIwNDIzIDEuMjE5NDI3IDEuMzI3MDI0IDEuOTk2NTEzQzEuMTk1NTE3IDIuMTM5OTc1IDEuMTk1NTE3IDIuMTYzODg1IDEuMTk1NTE3IDIuMTg3Nzk2QzEuMTk1NTE3IDIuMjQ3NTcyIDEuMjU1MjkzIDIuMzA3MzQ3IDEuMzE1MDY4IDIuMzA3MzQ3QzEuNDEwNzEgMi4zMDczNDcgMi4zMzEyNTggMS40MjI2NjUgMi4zMzEyNTggLjA0NzgyMVonLz4KPHBhdGggaWQ9J2cyLTExNScgZD0nTTIuNzI1Nzc4LTIuMzkxMDM0QzIuOTI5MDE2LTIuMzU1MTY4IDMuMjUxODA2LTIuMjgzNDM3IDMuMzIzNTM3LTIuMjcxNDgyQzMuNDc4OTU0LTIuMjIzNjYxIDQuMDE2OTM2LTIuMDMyMzc5IDQuMDE2OTM2LTEuNDU4NTMxQzQuMDE2OTM2LTEuMDg3OTIgMy42ODIxOTItLjExOTU1MiAyLjI5NTM5Mi0uMTE5NTUyQzIuMDQ0MzM0LS4xMTk1NTIgMS4xNDc2OTYtLjE1NTQxNyAuOTA4NTkzLS44MTI5NTFDMS4zODY4LS43NTMxNzYgMS42MjU5MDMtMS4xMjM3ODYgMS42MjU5MDMtMS4zODY4QzEuNjI1OTAzLTEuNjM3ODU4IDEuNDU4NTMxLTEuNzY5MzY1IDEuMjE5NDI3LTEuNzY5MzY1Qy45NTY0MTMtMS43NjkzNjUgLjYwOTcxNC0xLjU2NjEyNyAuNjA5NzE0LTEuMDI4MTQ0Qy42MDk3MTQtLjMyMjc5IDEuMzI3MDI0IC4xMTk1NTIgMi4yODM0MzcgLjExOTU1MkM0LjEwMDYyMyAuMTE5NTUyIDQuNjM4NjA1LTEuMjE5NDI3IDQuNjM4NjA1LTEuODQxMDk2QzQuNjM4NjA1LTIuMDIwNDIzIDQuNjM4NjA1LTIuMzU1MTY4IDQuMjU2MDQtMi43Mzc3MzNDMy45NTcxNjEtMy4wMjQ2NTggMy42NzAyMzctMy4wODQ0MzMgMy4wMjQ2NTgtMy4yMTU5NEMyLjcwMTg2OC0zLjI4NzY3MSAyLjE4Nzc5Ni0zLjM5NTI2OCAyLjE4Nzc5Ni0zLjkzMzI1QzIuMTg3Nzk2LTQuMTcyMzU0IDIuNDAyOTg5LTUuMDMzMTI2IDMuNTM4NzMtNS4wMzMxMjZDNC4wNDA4NDctNS4wMzMxMjYgNC41MzEwMDktNC44NDE4NDMgNC42NTA1Ni00LjQxMTQ1N0M0LjEyNDUzMy00LjQxMTQ1NyA0LjEwMDYyMy0zLjk1NzE2MSA0LjEwMDYyMy0zLjk0NTIwNUM0LjEwMDYyMy0zLjY5NDE0NyA0LjMyNzc3MS0zLjYyMjQxNiA0LjQzNTM2Ny0zLjYyMjQxNkM0LjYwMjc0LTMuNjIyNDE2IDQuOTM3NDg0LTMuNzUzOTIzIDQuOTM3NDg0LTQuMjU2MDRTNC40ODMxODgtNS4yNzIyMjkgMy41NTA2ODUtNS4yNzIyMjlDMS45ODQ1NTgtNS4yNzIyMjkgMS41NjYxMjctNC4wNDA4NDcgMS41NjYxMjctMy41NTA2ODVDMS41NjYxMjctMi42NDIwOTIgMi40NTA4MDktMi40NTA4MDkgMi43MjU3NzgtMi4zOTEwMzRaJy8+CjxwYXRoIGlkPSdnMi0xMjAnIGQ9J001LjY2Njc1LTQuODc3NzA5QzUuMjg0MTg0LTQuODA1OTc4IDUuMTQwNzIyLTQuNTE5MDU0IDUuMTQwNzIyLTQuMjkxOTA1QzUuMTQwNzIyLTQuMDA0OTgxIDUuMzY3ODctMy45MDkzNCA1LjUzNTI0My0zLjkwOTM0QzUuODkzODk4LTMuOTA5MzQgNi4xNDQ5NTYtNC4yMjAxNzQgNi4xNDQ5NTYtNC41NDI5NjRDNi4xNDQ5NTYtNS4wNDUwODEgNS41NzExMDgtNS4yNzIyMjkgNS4wNjg5OTEtNS4yNzIyMjlDNC4zMzk3MjYtNS4yNzIyMjkgMy45MzMyNS00LjU1NDkxOSAzLjgyNTY1NC00LjMyNzc3MUMzLjU1MDY4NS01LjIyNDQwOCAyLjgwOTQ2NS01LjI3MjIyOSAyLjU5NDI3MS01LjI3MjIyOUMxLjM3NDg0NC01LjI3MjIyOSAuNzI5MjY1LTMuNzA2MTAyIC43MjkyNjUtMy40NDMwODhDLjcyOTI2NS0zLjM5NTI2OCAuNzc3MDg2LTMuMzM1NDkyIC44NjA3NzItMy4zMzU0OTJDLjk1NjQxMy0zLjMzNTQ5MiAuOTgwMzI0LTMuNDA3MjIzIDEuMDA0MjM0LTMuNDU1MDQ0QzEuNDEwNzEtNC43ODIwNjcgMi4yMTE3MDYtNS4wMzMxMjYgMi41NTg0MDYtNS4wMzMxMjZDMy4wOTYzODktNS4wMzMxMjYgMy4yMDM5ODUtNC41MzEwMDkgMy4yMDM5ODUtNC4yNDQwODVDMy4yMDM5ODUtMy45ODEwNzEgMy4xMzIyNTQtMy43MDYxMDIgMi45ODg3OTItMy4xMzIyNTRMMi41ODIzMTYtMS40OTQzOTZDMi40MDI5ODktLjc3NzA4NiAyLjA1NjI4OS0uMTE5NTUyIDEuNDIyNjY1LS4xMTk1NTJDMS4zNjI4ODktLjExOTU1MiAxLjA2NDAxLS4xMTk1NTIgLjgxMjk1MS0uMjc0OTY5QzEuMjQzMzM3LS4zNTg2NTUgMS4zMzg5NzktLjcxNzMxIDEuMzM4OTc5LS44NjA3NzJDMS4zMzg5NzktMS4wOTk4NzUgMS4xNTk2NTEtMS4yNDMzMzcgLjkzMjUwMy0xLjI0MzMzN0MuNjQ1NTc5LTEuMjQzMzM3IC4zMzQ3NDUtLjk5MjI3OSAuMzM0NzQ1LS42MDk3MTRDLjMzNDc0NS0uMTA3NTk3IC44OTY2MzggLjExOTU1MiAxLjQxMDcxIC4xMTk1NTJDMS45ODQ1NTggLjExOTU1MiAyLjM5MTAzNC0uMzM0NzQ1IDIuNjQyMDkyLS44MjQ5MDdDMi44MzMzNzUtLjExOTU1MiAzLjQzMTEzMyAuMTE5NTUyIDMuODczNDc0IC4xMTk1NTJDNS4wOTI5MDIgLjExOTU1MiA1LjczODQ4MS0xLjQ0NjU3NSA1LjczODQ4MS0xLjcwOTU4OUM1LjczODQ4MS0xLjc2OTM2NSA1LjY5MDY2LTEuODE3MTg2IDUuNjE4OTI5LTEuODE3MTg2QzUuNTExMzMzLTEuODE3MTg2IDUuNDk5Mzc3LTEuNzU3NDEgNS40NjM1MTItMS42NjE3NjhDNS4xNDA3MjItLjYwOTcxNCA0LjQ0NzMyMy0uMTE5NTUyIDMuOTA5MzQtLjExOTU1MkMzLjQ5MDkwOS0uMTE5NTUyIDMuMjYzNzYxLS40MzAzODYgMy4yNjM3NjEtLjkyMDU0OEMzLjI2Mzc2MS0xLjE4MzU2MiAzLjMxMTU4Mi0xLjM3NDg0NCAzLjUwMjg2NC0yLjE2Mzg4NUwzLjkyMTI5NS0zLjc4OTc4OEM0LjEwMDYyMy00LjUwNzA5OCA0LjUwNzA5OC01LjAzMzEyNiA1LjA1NzAzNi01LjAzMzEyNkM1LjA4MDk0Ni01LjAzMzEyNiA1LjQxNTY5MS01LjAzMzEyNiA1LjY2Njc1LTQuODc3NzA5WicvPgo8L2RlZnM+CjxnIGlkPSdwYWdlMSc+Cjx1c2UgeD0nMCcgeT0nMCcgeGxpbms6aHJlZj0nI2cyLTExNScvPgo8dXNlIHg9JzguODM0ODM1JyB5PScwJyB4bGluazpocmVmPScjZzAtNTAnLz4KPHVzZSB4PScyMC4xMjU4MDMnIHk9JzAnIHhsaW5rOmhyZWY9JyNnMy05MScvPgo8dXNlIHg9JzIzLjM3NzQ2NCcgeT0nMCcgeGxpbms6aHJlZj0nI2cyLTEyMCcvPgo8dXNlIHg9JzMwLjAyOTU1MicgeT0nLTQuMzM4NDM3JyB4bGluazpocmVmPScjZzEtMTA5Jy8+Cjx1c2UgeD0nMzcuNTIwMDc4JyB5PSctNC4zMzg0MzcnIHhsaW5rOmhyZWY9JyNnMS0xMDUnLz4KPHVzZSB4PSc0MC40MDMyMTcnIHk9Jy00LjMzODQzNycgeGxpbms6aHJlZj0nI2cxLTExMCcvPgo8dXNlIHg9JzMwLjAyOTU1MicgeT0nMi45NTU1MTUnIHhsaW5rOmhyZWY9JyNnMS0xMDUnLz4KPHVzZSB4PSc0Ni4wMzk1NTInIHk9JzAnIHhsaW5rOmhyZWY9JyNnMi01OScvPgo8dXNlIHg9JzUxLjI4MzcxMScgeT0nMCcgeGxpbms6aHJlZj0nI2cyLTEyMCcvPgo8dXNlIHg9JzU3LjkzNTc5OCcgeT0nLTQuMzM4NDM3JyB4bGluazpocmVmPScjZzEtMTA5Jy8+Cjx1c2UgeD0nNjUuNDI2MzI0JyB5PSctNC4zMzg0MzcnIHhsaW5rOmhyZWY9JyNnMS05NycvPgo8dXNlIHg9JzY5LjkyNDMzNCcgeT0nLTQuMzM4NDM3JyB4bGluazpocmVmPScjZzEtMTIwJy8+Cjx1c2UgeD0nNTcuOTM1Nzk4JyB5PScyLjk1NTUxNScgeGxpbms6aHJlZj0nI2cxLTEwNScvPgo8dXNlIHg9Jzc1LjE4OTM2NScgeT0nMCcgeGxpbms6aHJlZj0nI2czLTkzJy8+CjwvZz4KPC9zdmc+CjwhLS0gREVQVEg9NCAtLT4=) where
where  is defined by the equation:
In the second usage:
Draws the iso-curves of the given outputMarg marginal
 as a
function of the given 2D firstInputMarg and secondInputMarg marginals
with respect to the variation of
as a
function of the given 2D firstInputMarg and secondInputMarg marginals
with respect to the variation of  in the interval
![[x_i^{min}, x_i^{max}] \times [x_j^{min}, x_j^{max}]](data:image/svg+xml;base64,PD94bWwgdmVyc2lvbj0nMS4wJyBlbmNvZGluZz0nVVRGLTgnPz4KPCEtLSBUaGlzIGZpbGUgd2FzIGdlbmVyYXRlZCBieSBkdmlzdmdtIDMuNC4yIC0tPgo8c3ZnIHZlcnNpb249JzEuMScgeG1sbnM9J2h0dHA6Ly93d3cudzMub3JnLzIwMDAvc3ZnJyB4bWxuczp4bGluaz0naHR0cDovL3d3dy53My5vcmcvMTk5OS94bGluaycgd2lkdGg9JzEzMS4yNDIyN3B0JyBoZWlnaHQ9JzE0LjExMjYzNXB0JyB2aWV3Qm94PScwIC05LjYwNzM3NCAxMzEuMjQyMjcgMTQuMTEyNjM1Jz4KPGRlZnM+CjxwYXRoIGlkPSdnMS05NycgZD0nTTMuMTI0Mjg0LTMuMDM2NjEzQzMuMDUyNTUzLTMuMTcyMTA1IDIuODIxNDItMy41MTQ4MTkgMi4zMzUyNDMtMy41MTQ4MTlDMS4zODY4LTMuNTE0ODE5IC4zNDI3MTUtMi40MDY5NzQgLjM0MjcxNS0xLjIyNzM5N0MuMzQyNzE1LS4zOTg1MDYgLjg3NjcxMiAuMDc5NzAxIDEuNDkwNDExIC4wNzk3MDFDMi4wMDA0OTggLjA3OTcwMSAyLjQzODg1NC0uMzI2Nzc1IDIuNTgyMzE2LS40ODYxNzdDMi43MjU3NzggLjA2Mzc2MSAzLjI2Nzc0NiAuMDc5NzAxIDMuMzYzMzg3IC4wNzk3MDFDMy43MzAwMTIgLjA3OTcwMSAzLjkxMzMyNS0uMjIzMTYzIDMuOTc3MDg2LS4zNTg2NTVDNC4xMzY0ODgtLjY0NTU3OSA0LjI0ODA3LTEuMTA3ODQ2IDQuMjQ4MDctMS4xMzk3MjZDNC4yNDgwNy0xLjE4NzU0NyA0LjIxNjE4OS0xLjI0MzMzNyA0LjEyMDU0OC0xLjI0MzMzN1M0LjAwODk2Ni0xLjE5NTUxNyAzLjk2MTE0Ni0uOTk2MjY0QzMuODQ5NTY0LS41NTc5MDggMy42OTgxMzItLjE0MzQ2MiAzLjM4NzI5OC0uMTQzNDYyQzMuMjAzOTg1LS4xNDM0NjIgMy4xMzIyNTQtLjI5NDg5NCAzLjEzMjI1NC0uNTE4MDU3QzMuMTMyMjU0LS42NTM1NDkgMy4yMDM5ODUtLjkyNDUzMyAzLjI1MTgwNi0xLjEyMzc4NlMzLjQxOTE3OC0xLjgwMTI0NSAzLjQ1MTA1OS0xLjk0NDcwN0wzLjYxMDQ2MS0yLjU1MDQzNkMzLjY1MDMxMS0yLjc0MTcxOSAzLjczNzk4My0zLjA3NjQ2MyAzLjczNzk4My0zLjExNjMxNEMzLjczNzk4My0zLjI5OTYyNiAzLjU4NjU1LTMuMzYzMzg3IDMuNDgyOTM5LTMuMzYzMzg3QzMuMzYzMzg3LTMuMzYzMzg3IDMuMTY0MTM0LTMuMjgzNjg2IDMuMTI0Mjg0LTMuMDM2NjEzWk0yLjU4MjMxNi0uODYwNzcyQzIuMTgzODExLS4zMTA4MzQgMS43NjkzNjUtLjE0MzQ2MiAxLjUxNDMyMS0uMTQzNDYyQzEuMTQ3Njk2LS4xNDM0NjIgLjk2NDM4NC0uNDc4MjA3IC45NjQzODQtLjg5MjY1M0MuOTY0Mzg0LTEuMjY3MjQ4IDEuMTc5NTc3LTIuMTIwMDUgMS4zNTQ5MTktMi40NzA3MzVDMS41ODYwNTItMi45NTY5MTIgMS45NzY1ODgtMy4yOTE2NTYgMi4zNDMyMTMtMy4yOTE2NTZDMi44NjEyNy0zLjI5MTY1NiAzLjAxMjcwMi0yLjcwOTgzOCAzLjAxMjcwMi0yLjYxNDE5N0MzLjAxMjcwMi0yLjU4MjMxNiAyLjgxMzQ1LTEuODAxMjQ1IDIuNzY1NjI5LTEuNTk0MDIyQzIuNjYyMDE3LTEuMjE5NDI3IDIuNjYyMDE3LTEuMjAzNDg3IDIuNTgyMzE2LS44NjA3NzJaJy8+CjxwYXRoIGlkPSdnMS0xMDUnIGQ9J00yLjM3NTA5My00Ljk3MzM1QzIuMzc1MDkzLTUuMTQ4NjkyIDIuMjQ3NTcyLTUuMjc2MjE0IDIuMDY0MjU5LTUuMjc2MjE0QzEuODU3MDM2LTUuMjc2MjE0IDEuNjI1OTAzLTUuMDg0OTMyIDEuNjI1OTAzLTQuODQ1ODI4QzEuNjI1OTAzLTQuNjcwNDg2IDEuNzUzNDI1LTQuNTQyOTY0IDEuOTM2NzM3LTQuNTQyOTY0QzIuMTQzOTYtNC41NDI5NjQgMi4zNzUwOTMtNC43MzQyNDcgMi4zNzUwOTMtNC45NzMzNVpNMS4yMTE0NTctMi4wNDgzMTlMLjc4MTA3MS0uOTQ4NDQzQy43NDEyMi0uODI4ODkyIC43MDEzNy0uNzMzMjUgLjcwMTM3LS41OTc3NThDLjcwMTM3LS4yMDcyMjMgMS4wMDQyMzQgLjA3OTcwMSAxLjQyNjY1IC4wNzk3MDFDMi4xOTk3NTEgLjA3OTcwMSAyLjUyNjUyNi0xLjAzNjExNSAyLjUyNjUyNi0xLjEzOTcyNkMyLjUyNjUyNi0xLjIxOTQyNyAyLjQ2Mjc2NS0xLjI0MzMzNyAyLjQwNjk3NC0xLjI0MzMzN0MyLjMxMTMzMy0xLjI0MzMzNyAyLjI5NTM5Mi0xLjE4NzU0NyAyLjI3MTQ4Mi0xLjEwNzg0NkMyLjA4ODE2OS0uNDcwMjM3IDEuNzYxMzk1LS4xNDM0NjIgMS40NDI1OS0uMTQzNDYyQzEuMzQ2OTQ5LS4xNDM0NjIgMS4yNTEzMDgtLjE4MzMxMyAxLjI1MTMwOC0uMzk4NTA2QzEuMjUxMzA4LS41ODk3ODggMS4zMDcwOTgtLjczMzI1IDEuNDEwNzEtLjk4MDMyNEMxLjQ5MDQxMS0xLjE5NTUxNyAxLjU3MDExMi0xLjQxMDcxIDEuNjU3NzgzLTEuNjI1OTAzTDEuOTA0ODU3LTIuMjcxNDgyQzEuOTc2NTg4LTIuNDU0Nzk1IDIuMDcyMjI5LTIuNzAxODY4IDIuMDcyMjI5LTIuODM3MzZDMi4wNzIyMjktMy4yMzU4NjYgMS43NTM0MjUtMy41MTQ4MTkgMS4zNDY5NDktMy41MTQ4MTlDLjU3Mzg0OC0zLjUxNDgxOSAuMjM5MTAzLTIuMzk5MDA0IC4yMzkxMDMtMi4yOTUzOTJDLjIzOTEwMy0yLjIyMzY2MSAuMjk0ODk0LTIuMTkxNzgxIC4zNTg2NTUtMi4xOTE3ODFDLjQ2MjI2Ny0yLjE5MTc4MSAuNDcwMjM3LTIuMjM5NjAxIC40OTQxNDctMi4zMTkzMDNDLjcxNzMxLTMuMDc2NDYzIDEuMDgzOTM1LTMuMjkxNjU2IDEuMzIzMDM5LTMuMjkxNjU2QzEuNDM0NjItMy4yOTE2NTYgMS41MTQzMjEtMy4yNTE4MDYgMS41MTQzMjEtMy4wMjg2NDNDMS41MTQzMjEtMi45NDg5NDEgMS41MDYzNTEtMi44MzczNiAxLjQyNjY1LTIuNTk4MjU3TDEuMjExNDU3LTIuMDQ4MzE5WicvPgo8cGF0aCBpZD0nZzEtMTA2JyBkPSdNMy4yOTE2NTYtNC45NzMzNUMzLjI5MTY1Ni01LjEyNDc4MiAzLjE3MjEwNS01LjI3NjIxNCAyLjk4MDgyMi01LjI3NjIxNEMyLjc0MTcxOS01LjI3NjIxNCAyLjUzNDQ5Ni01LjA1MzA1MSAyLjUzNDQ5Ni00Ljg0NTgyOEMyLjUzNDQ5Ni00LjY5NDM5NiAyLjY1NDA0Ny00LjU0Mjk2NCAyLjg0NTMzLTQuNTQyOTY0QzMuMDg0NDMzLTQuNTQyOTY0IDMuMjkxNjU2LTQuNzY2MTI3IDMuMjkxNjU2LTQuOTczMzVaTTEuNjI1OTAzIC4zOTg1MDZDMS41MDYzNTEgLjg4NDY4MiAxLjExNTgxNiAxLjQwMjc0IC42Mjk2MzkgMS40MDI3NEMuNTAyMTE3IDEuNDAyNzQgLjM4MjU2NSAxLjM3MDg1OSAuMzY2NjI1IDEuMzYyODg5Qy42MTM2OTkgMS4yNDMzMzcgLjY0NTU3OSAxLjAyODE0NCAuNjQ1NTc5IC45NTY0MTNDLjY0NTU3OSAuNzY1MTMxIC41MDIxMTcgLjY2MTUxOSAuMzM0NzQ1IC42NjE1MTlDLjEwMzYxMSAuNjYxNTE5LS4xMTE1ODIgLjg2MDc3Mi0uMTExNTgyIDEuMTIzNzg2Qy0uMTExNTgyIDEuNDI2NjUgLjE4MzMxMyAxLjYyNTkwMyAuNjM3NjA5IDEuNjI1OTAzQzEuMTIzNzg2IDEuNjI1OTAzIDIuMDAwNDk4IDEuMzIzMDM5IDIuMjM5NjAxIC4zNjY2MjVMMi45NTY5MTItMi40ODY2NzVDMi45ODA4MjItMi41ODIzMTYgMi45OTY3NjItMi42NDYwNzcgMi45OTY3NjItMi43NjU2MjlDMi45OTY3NjItMy4yMDM5ODUgMi42NDYwNzctMy41MTQ4MTkgMi4xODM4MTEtMy41MTQ4MTlDMS4zMzg5NzktMy41MTQ4MTkgLjg0NDgzMi0yLjM5OTAwNCAuODQ0ODMyLTIuMjk1MzkyQy44NDQ4MzItMi4yMjM2NjEgLjkwMDYyMy0yLjE5MTc4MSAuOTY0Mzg0LTIuMTkxNzgxQzEuMDUyMDU1LTIuMTkxNzgxIDEuMDYwMDI1LTIuMjE1NjkxIDEuMTE1ODE2LTIuMzM1MjQzQzEuMzU0OTE5LTIuODg1MTgxIDEuNzYxMzk1LTMuMjkxNjU2IDIuMTU5OS0zLjI5MTY1NkMyLjMyNzI3My0zLjI5MTY1NiAyLjQyMjkxNC0zLjE4MDA3NSAyLjQyMjkxNC0yLjkxNzA2MUMyLjQyMjkxNC0yLjgwNTQ3OSAyLjM5OTAwNC0yLjY5Mzg5OCAyLjM3NTA5My0yLjU4MjMxNkwxLjYyNTkwMyAuMzk4NTA2WicvPgo8cGF0aCBpZD0nZzEtMTA5JyBkPSdNMS41OTQwMjItMS4zMDcwOThDMS42MTc5MzMtMS40MjY2NSAxLjY5NzYzNC0xLjcyOTUxNCAxLjcyMTU0NC0xLjg0OTA2NkMxLjc0NTQ1NS0xLjkyODc2NyAxLjc5MzI3NS0yLjEyMDA1IDEuODA5MjE1LTIuMTk5NzUxQzEuODI1MTU2LTIuMjM5NjAxIDIuMDg4MTY5LTIuNzU3NjU5IDIuNDM4ODU0LTMuMDIwNjcyQzIuNzA5ODM4LTMuMjI3ODk1IDIuOTcyODUyLTMuMjkxNjU2IDMuMTk2MDE1LTMuMjkxNjU2QzMuNDkwOTA5LTMuMjkxNjU2IDMuNjUwMzExLTMuMTE2MzE0IDMuNjUwMzExLTIuNzQ5Njg5QzMuNjUwMzExLTIuNTU4NDA2IDMuNjAyNDkxLTIuMzc1MDkzIDMuNTE0ODE5LTIuMDE2NDM4QzMuNDU5MDI5LTEuODA5MjE1IDMuMzIzNTM3LTEuMjc1MjE4IDMuMjc1NzE2LTEuMDYwMDI1TDMuMTU2MTY0LS41ODE4MThDMy4xMTYzMTQtLjQ0NjMyNiAzLjA2MDUyMy0uMjA3MjIzIDMuMDYwNTIzLS4xNjczNzJDMy4wNjA1MjMgLjAxNTk0IDMuMjExOTU1IC4wNzk3MDEgMy4zMTU1NjcgLjA3OTcwMUMzLjQ1OTAyOSAuMDc5NzAxIDMuNTc4NTgtLjAxNTk0IDMuNjM0MzcxLS4xMTE1ODJDMy42NTgyODEtLjE1OTQwMiAzLjcyMjA0Mi0uNDMwMzg2IDMuNzYxODkzLS41OTc3NThMMy45NDUyMDUtMS4zMDcwOThDMy45NjkxMTYtMS40MjY2NSA0LjA0ODgxNy0xLjcyOTUxNCA0LjA3MjcyNy0xLjg0OTA2NkM0LjE4NDMwOS0yLjI3OTQ1MiA0LjE4NDMwOS0yLjI4NzQyMiA0LjM2NzYyMS0yLjU1MDQzNkM0LjYzMDYzNS0yLjk0MDk3MSA1LjAwNTIzLTMuMjkxNjU2IDUuNTM5MjI4LTMuMjkxNjU2QzUuODI2MTUyLTMuMjkxNjU2IDUuOTkzNTI0LTMuMTI0Mjg0IDUuOTkzNTI0LTIuNzQ5Njg5QzUuOTkzNTI0LTIuMzExMzMzIDUuNjU4NzgtMS4zOTQ3NyA1LjUwNzM0Ny0xLjAxMjIwNEM1LjQyNzY0Ni0uODA0OTgxIDUuNDAzNzM2LS43NDkxOTEgNS40MDM3MzYtLjU5Nzc1OEM1LjQwMzczNi0uMTQzNDYyIDUuNzc4MzMxIC4wNzk3MDEgNi4xMjEwNDYgLjA3OTcwMUM2LjkwMjExNyAuMDc5NzAxIDcuMjI4ODkyLTEuMDM2MTE1IDcuMjI4ODkyLTEuMTM5NzI2QzcuMjI4ODkyLTEuMjE5NDI3IDcuMTY1MTMxLTEuMjQzMzM3IDcuMTA5MzQtMS4yNDMzMzdDNy4wMTM2OTktMS4yNDMzMzcgNi45OTc3NTgtMS4xODc1NDcgNi45NzM4NDgtMS4xMDc4NDZDNi43ODI1NjUtLjQ0NjMyNiA2LjQ0NzgyMS0uMTQzNDYyIDYuMTQ0OTU2LS4xNDM0NjJDNi4wMTc0MzUtLjE0MzQ2MiA1Ljk1MzY3NC0uMjIzMTYzIDUuOTUzNjc0LS40MDY0NzZTNi4wMTc0MzUtLjc2NTEzMSA2LjA5NzEzNi0uOTY0Mzg0QzYuMjE2Njg3LTEuMjY3MjQ4IDYuNTY3MzcyLTIuMTgzODExIDYuNTY3MzcyLTIuNjMwMTM3QzYuNTY3MzcyLTMuMjI3ODk1IDYuMTUyOTI3LTMuNTE0ODE5IDUuNTc5MDc4LTMuNTE0ODE5QzUuMDI5MTQxLTMuNTE0ODE5IDQuNTc0ODQ0LTMuMjI3ODk1IDQuMjE2MTg5LTIuNzMzNzQ4QzQuMTUyNDI4LTMuMzcxMzU3IDMuNjQyMzQxLTMuNTE0ODE5IDMuMjI3ODk1LTMuNTE0ODE5QzIuODYxMjctMy41MTQ4MTkgMi4zNzUwOTMtMy4zODcyOTggMS45MzY3MzctMi44MTM0NUMxLjg4MDk0Ni0zLjI5MTY1NiAxLjQ5ODM4MS0zLjUxNDgxOSAxLjEyMzc4Ni0zLjUxNDgxOUMuODQ0ODMyLTMuNTE0ODE5IC42NDU1NzktMy4zNDc0NDcgLjUxMDA4Ny0zLjA3NjQ2M0MuMzE4ODA0LTIuNzAxODY4IC4yMzkxMDMtMi4zMTEzMzMgLjIzOTEwMy0yLjI5NTM5MkMuMjM5MTAzLTIuMjIzNjYxIC4yOTQ4OTQtMi4xOTE3ODEgLjM1ODY1NS0yLjE5MTc4MUMuNDYyMjY3LTIuMTkxNzgxIC40NzAyMzctMi4yMjM2NjEgLjUyNjAyNy0yLjQzMDg4NEMuNjIxNjY5LTIuODIxNDIgLjc2NTEzMS0zLjI5MTY1NiAxLjA5OTg3NS0zLjI5MTY1NkMxLjMwNzA5OC0zLjI5MTY1NiAxLjM1NDkxOS0zLjA5MjQwMyAxLjM1NDkxOS0yLjkxNzA2MUMxLjM1NDkxOS0yLjc3MzU5OSAxLjMxNTA2OC0yLjYyMjE2NyAxLjI1MTMwOC0yLjM1OTE1M0MxLjIzNTM2Ny0yLjI5NTM5MiAxLjExNTgxNi0xLjgyNTE1NiAxLjA4MzkzNS0xLjcxMzU3NEwuNzg5MDQxLS41MTgwNTdDLjc1NzE2MS0uMzk4NTA2IC43MDkzNC0uMTk5MjUzIC43MDkzNC0uMTY3MzcyQy43MDkzNCAuMDE1OTQgLjg2MDc3MiAuMDc5NzAxIC45NjQzODQgLjA3OTcwMUMxLjEwNzg0NiAuMDc5NzAxIDEuMjI3Mzk3LS4wMTU5NCAxLjI4MzE4OC0uMTExNTgyQzEuMzA3MDk4LS4xNTk0MDIgMS4zNzA4NTktLjQzMDM4NiAxLjQxMDcxLS41OTc3NThMMS41OTQwMjItMS4zMDcwOThaJy8+CjxwYXRoIGlkPSdnMS0xMTAnIGQ9J00xLjU5NDAyMi0xLjMwNzA5OEMxLjYxNzkzMy0xLjQyNjY1IDEuNjk3NjM0LTEuNzI5NTE0IDEuNzIxNTQ0LTEuODQ5MDY2QzEuODMzMTI2LTIuMjc5NDUyIDEuODMzMTI2LTIuMjg3NDIyIDIuMDE2NDM4LTIuNTUwNDM2QzIuMjc5NDUyLTIuOTQwOTcxIDIuNjU0MDQ3LTMuMjkxNjU2IDMuMTg4MDQ1LTMuMjkxNjU2QzMuNDc0OTY5LTMuMjkxNjU2IDMuNjQyMzQxLTMuMTI0Mjg0IDMuNjQyMzQxLTIuNzQ5Njg5QzMuNjQyMzQxLTIuMzExMzMzIDMuMzA3NTk3LTEuNDAyNzQgMy4xNTYxNjQtMS4wMTIyMDRDMy4wNTI1NTMtLjc0OTE5MSAzLjA1MjU1My0uNzAxMzcgMy4wNTI1NTMtLjU5Nzc1OEMzLjA1MjU1My0uMTQzNDYyIDMuNDI3MTQ4IC4wNzk3MDEgMy43Njk4NjMgLjA3OTcwMUM0LjU1MDkzNCAuMDc5NzAxIDQuODc3NzA5LTEuMDM2MTE1IDQuODc3NzA5LTEuMTM5NzI2QzQuODc3NzA5LTEuMjE5NDI3IDQuODEzOTQ4LTEuMjQzMzM3IDQuNzU4MTU3LTEuMjQzMzM3QzQuNjYyNTE2LTEuMjQzMzM3IDQuNjQ2NTc1LTEuMTg3NTQ3IDQuNjIyNjY1LTEuMTA3ODQ2QzQuNDMxMzgyLS40NTQyOTYgNC4wOTY2MzgtLjE0MzQ2MiAzLjc5Mzc3My0uMTQzNDYyQzMuNjY2MjUyLS4xNDM0NjIgMy42MDI0OTEtLjIyMzE2MyAzLjYwMjQ5MS0uNDA2NDc2UzMuNjY2MjUyLS43NjUxMzEgMy43NDU5NTMtLjk2NDM4NEMzLjg2NTUwNC0xLjI2NzI0OCA0LjIxNjE4OS0yLjE4MzgxMSA0LjIxNjE4OS0yLjYzMDEzN0M0LjIxNjE4OS0zLjIyNzg5NSAzLjgwMTc0My0zLjUxNDgxOSAzLjIyNzg5NS0zLjUxNDgxOUMyLjU4MjMxNi0zLjUxNDgxOSAyLjE2Nzg3LTMuMTI0Mjg0IDEuOTM2NzM3LTIuODIxNDJDMS44ODA5NDYtMy4yNTk3NzYgMS41MzAyNjItMy41MTQ4MTkgMS4xMjM3ODYtMy41MTQ4MTlDLjgzNjg2Mi0zLjUxNDgxOSAuNjM3NjA5LTMuMzMxNTA3IC41MTAwODctMy4wODQ0MzNDLjMxODgwNC0yLjcwOTgzOCAuMjM5MTAzLTIuMzExMzMzIC4yMzkxMDMtMi4yOTUzOTJDLjIzOTEwMy0yLjIyMzY2MSAuMjk0ODk0LTIuMTkxNzgxIC4zNTg2NTUtMi4xOTE3ODFDLjQ2MjI2Ny0yLjE5MTc4MSAuNDcwMjM3LTIuMjIzNjYxIC41MjYwMjctMi40MzA4ODRDLjYyMTY2OS0yLjgyMTQyIC43NjUxMzEtMy4yOTE2NTYgMS4wOTk4NzUtMy4yOTE2NTZDMS4zMDcwOTgtMy4yOTE2NTYgMS4zNTQ5MTktMy4wOTI0MDMgMS4zNTQ5MTktMi45MTcwNjFDMS4zNTQ5MTktMi43NzM1OTkgMS4zMTUwNjgtMi42MjIxNjcgMS4yNTEzMDgtMi4zNTkxNTNDMS4yMzUzNjctMi4yOTUzOTIgMS4xMTU4MTYtMS44MjUxNTYgMS4wODM5MzUtMS43MTM1NzRMLjc4OTA0MS0uNTE4MDU3Qy43NTcxNjEtLjM5ODUwNiAuNzA5MzQtLjE5OTI1MyAuNzA5MzQtLjE2NzM3MkMuNzA5MzQgLjAxNTk0IC44NjA3NzIgLjA3OTcwMSAuOTY0Mzg0IC4wNzk3MDFDMS4xMDc4NDYgLjA3OTcwMSAxLjIyNzM5Ny0uMDE1OTQgMS4yODMxODgtLjExMTU4MkMxLjMwNzA5OC0uMTU5NDAyIDEuMzcwODU5LS40MzAzODYgMS40MTA3MS0uNTk3NzU4TDEuNTk0MDIyLTEuMzA3MDk4WicvPgo8cGF0aCBpZD0nZzEtMTIwJyBkPSdNMy45OTMwMjYtMy4xODAwNzVDMy42NDIzNDEtMy4wOTI0MDMgMy42MjY0MDEtMi43ODE1NjkgMy42MjY0MDEtMi43NDk2ODlDMy42MjY0MDEtMi41NzQzNDYgMy43NjE4OTMtMi40NTQ3OTUgMy45MzcyMzUtMi40NTQ3OTVTNC4zODM1NjItMi41OTAyODYgNC4zODM1NjItMi45MzMwMDFDNC4zODM1NjItMy4zODcyOTggMy44ODE0NDUtMy41MTQ4MTkgMy41ODY1NS0zLjUxNDgxOUMzLjIxMTk1NS0zLjUxNDgxOSAyLjkwOTA5MS0zLjI1MTgwNiAyLjcyNTc3OC0yLjk0MDk3MUMyLjU1MDQzNi0zLjM2MzM4NyAyLjEzNTk5LTMuNTE0ODE5IDEuODA5MjE1LTMuNTE0ODE5Qy45NDA0NzMtMy41MTQ4MTkgLjQ1NDI5Ni0yLjUxODU1NSAuNDU0Mjk2LTIuMjk1MzkyQy40NTQyOTYtMi4yMjM2NjEgLjUxMDA4Ny0yLjE5MTc4MSAuNTczODQ4LTIuMTkxNzgxQy42Njk0ODktMi4xOTE3ODEgLjY4NTQzLTIuMjMxNjMxIC43MDkzNC0yLjMyNzI3M0MuODkyNjUzLTIuOTA5MDkxIDEuMzcwODU5LTMuMjkxNjU2IDEuNzg1MzA1LTMuMjkxNjU2QzIuMDk2MTM5LTMuMjkxNjU2IDIuMjQ3NTcyLTMuMDY4NDkzIDIuMjQ3NTcyLTIuNzgxNTY5QzIuMjQ3NTcyLTIuNjIyMTY3IDIuMTUxOTMtMi4yNTU1NDIgMi4wODgxNjktMi4wMDA0OThDMi4wMzIzNzktMS43NjkzNjUgMS44NTcwMzYtMS4wNjAwMjUgMS44MTcxODYtLjkwODU5M0MxLjcwNTYwNC0uNDc4MjA3IDEuNDE4NjgtLjE0MzQ2MiAxLjA2MDAyNS0uMTQzNDYyQzEuMDI4MTQ0LS4xNDM0NjIgLjgyMDkyMi0uMTQzNDYyIC42NTM1NDktLjI1NTA0NEMxLjAyMDE3NC0uMzQyNzE1IDEuMDIwMTc0LS42Nzc0NiAxLjAyMDE3NC0uNjg1NDNDMS4wMjAxNzQtLjg2ODc0MiAuODc2NzEyLS45ODAzMjQgLjcwMTM3LS45ODAzMjRDLjQ4NjE3Ny0uOTgwMzI0IC4yNTUwNDQtLjc5NzAxMSAuMjU1MDQ0LS40OTQxNDdDLjI1NTA0NC0uMTI3NTIyIC42NDU1NzkgLjA3OTcwMSAxLjA1MjA1NSAuMDc5NzAxQzEuNDc0NDcxIC4wNzk3MDEgMS43NjkzNjUtLjIzOTEwMyAxLjkxMjgyNy0uNDk0MTQ3QzIuMDg4MTY5LS4xMDM2MTEgMi40NTQ3OTUgLjA3OTcwMSAyLjgzNzM2IC4wNzk3MDFDMy43MDYxMDIgLjA3OTcwMSA0LjE4NDMwOS0uOTE2NTYzIDQuMTg0MzA5LTEuMTM5NzI2QzQuMTg0MzA5LTEuMjE5NDI3IDQuMTIwNTQ4LTEuMjQzMzM3IDQuMDY0NzU3LTEuMjQzMzM3QzMuOTY5MTE2LTEuMjQzMzM3IDMuOTUzMTc2LTEuMTg3NTQ3IDMuOTI5MjY1LTEuMTA3ODQ2QzMuNzY5ODYzLS41NzM4NDggMy4zMTU1NjctLjE0MzQ2MiAyLjg1MzMtLjE0MzQ2MkMyLjU5MDI4Ni0uMTQzNDYyIDIuMzk5MDA0LS4zMTg4MDQgMi4zOTkwMDQtLjY1MzU0OUMyLjM5OTAwNC0uODEyOTUxIDIuNDQ2ODI0LS45OTYyNjQgMi41NTg0MDYtMS40NDI1OUMyLjYxNDE5Ny0xLjY4MTY5NCAyLjc4OTUzOS0yLjM4MzA2NCAyLjgyOTM5LTIuNTM0NDk2QzIuOTQwOTcxLTIuOTQ4OTQxIDMuMjE5OTI1LTMuMjkxNjU2IDMuNTc4NTgtMy4yOTE2NTZDMy42MTg0MzEtMy4yOTE2NTYgMy44MjU2NTQtMy4yOTE2NTYgMy45OTMwMjYtMy4xODAwNzVaJy8+CjxwYXRoIGlkPSdnMC0yJyBkPSdNNC42NTA1Ni0zLjMyMzUzN0wyLjI1OTUyNy01LjcwMjYxNUMyLjExNjA2NS01Ljg0NjA3NyAyLjA5MjE1NC01Ljg2OTk4OCAxLjk5NjUxMy01Ljg2OTk4OEMxLjg3Njk2MS01Ljg2OTk4OCAxLjc1NzQxLTUuNzYyMzkxIDEuNzU3NDEtNS42MzA4ODRDMS43NTc0MS01LjU0NzE5OCAxLjc4MTMyLTUuNTIzMjg4IDEuOTEyODI3LTUuMzkxNzgxTDQuMzAzODYxLTIuOTg4NzkyTDEuOTEyODI3LS41ODU4MDNDMS43ODEzMi0uNDU0Mjk2IDEuNzU3NDEtLjQzMDM4NiAxLjc1NzQxLS4zNDY3QzEuNzU3NDEtLjIxNTE5MyAxLjg3Njk2MS0uMTA3NTk3IDEuOTk2NTEzLS4xMDc1OTdDMi4wOTIxNTQtLjEwNzU5NyAyLjExNjA2NS0uMTMxNTA3IDIuMjU5NTI3LS4yNzQ5NjlMNC42Mzg2MDUtMi42NTQwNDdMNy4xMTMzMjUtLjE3OTMyOEM3LjEzNzIzNS0uMTY3MzcyIDcuMjIwOTIyLS4xMDc1OTcgNy4yOTI2NTMtLjEwNzU5N0M3LjQzNjExNS0uMTA3NTk3IDcuNTMxNzU2LS4yMTUxOTMgNy41MzE3NTYtLjM0NjdDNy41MzE3NTYtLjM3MDYxIDcuNTMxNzU2LS40MTg0MzEgNy40OTU4OS0uNDc4MjA3QzcuNDgzOTM1LS41MDIxMTcgNS41ODMwNjQtMi4zNzkwNzggNC45ODUzMDUtMi45ODg3OTJMNy4xNzMxMDEtNS4xNzY1ODhDNy4yMzI4NzctNS4yNDgzMTkgNy40MTIyMDQtNS40MDM3MzYgNy40NzE5OC01LjQ3NTQ2N0M3LjQ4MzkzNS01LjQ5OTM3NyA3LjUzMTc1Ni01LjU0NzE5OCA3LjUzMTc1Ni01LjYzMDg4NEM3LjUzMTc1Ni01Ljc2MjM5MSA3LjQzNjExNS01Ljg2OTk4OCA3LjI5MjY1My01Ljg2OTk4OEM3LjE5NzAxMS01Ljg2OTk4OCA3LjE0OTE5MS01LjgyMjE2NyA3LjAxNzY4NC01LjY5MDY2TDQuNjUwNTYtMy4zMjM1MzdaJy8+CjxwYXRoIGlkPSdnMi01OScgZD0nTTIuMzMxMjU4IC4wNDc4MjFDMi4zMzEyNTgtLjY0NTU3OSAyLjEwNDExLTEuMTU5NjUxIDEuNjEzOTQ4LTEuMTU5NjUxQzEuMjMxMzgyLTEuMTU5NjUxIDEuMDQwMS0uODQ4ODE3IDEuMDQwMS0uNTg1ODAzUzEuMjE5NDI3IDAgMS42MjU5MDMgMEMxLjc4MTMyIDAgMS45MTI4MjctLjA0NzgyMSAyLjAyMDQyMy0uMTU1NDE3QzIuMDQ0MzM0LS4xNzkzMjggMi4wNTYyODktLjE3OTMyOCAyLjA2ODI0NC0uMTc5MzI4QzIuMDkyMTU0LS4xNzkzMjggMi4wOTIxNTQtLjAxMTk1NSAyLjA5MjE1NCAuMDQ3ODIxQzIuMDkyMTU0IC40NDIzNDEgMi4wMjA0MjMgMS4yMTk0MjcgMS4zMjcwMjQgMS45OTY1MTNDMS4xOTU1MTcgMi4xMzk5NzUgMS4xOTU1MTcgMi4xNjM4ODUgMS4xOTU1MTcgMi4xODc3OTZDMS4xOTU1MTcgMi4yNDc1NzIgMS4yNTUyOTMgMi4zMDczNDcgMS4zMTUwNjggMi4zMDczNDdDMS40MTA3MSAyLjMwNzM0NyAyLjMzMTI1OCAxLjQyMjY2NSAyLjMzMTI1OCAuMDQ3ODIxWicvPgo8cGF0aCBpZD0nZzItMTIwJyBkPSdNNS42NjY3NS00Ljg3NzcwOUM1LjI4NDE4NC00LjgwNTk3OCA1LjE0MDcyMi00LjUxOTA1NCA1LjE0MDcyMi00LjI5MTkwNUM1LjE0MDcyMi00LjAwNDk4MSA1LjM2Nzg3LTMuOTA5MzQgNS41MzUyNDMtMy45MDkzNEM1Ljg5Mzg5OC0zLjkwOTM0IDYuMTQ0OTU2LTQuMjIwMTc0IDYuMTQ0OTU2LTQuNTQyOTY0QzYuMTQ0OTU2LTUuMDQ1MDgxIDUuNTcxMTA4LTUuMjcyMjI5IDUuMDY4OTkxLTUuMjcyMjI5QzQuMzM5NzI2LTUuMjcyMjI5IDMuOTMzMjUtNC41NTQ5MTkgMy44MjU2NTQtNC4zMjc3NzFDMy41NTA2ODUtNS4yMjQ0MDggMi44MDk0NjUtNS4yNzIyMjkgMi41OTQyNzEtNS4yNzIyMjlDMS4zNzQ4NDQtNS4yNzIyMjkgLjcyOTI2NS0zLjcwNjEwMiAuNzI5MjY1LTMuNDQzMDg4Qy43MjkyNjUtMy4zOTUyNjggLjc3NzA4Ni0zLjMzNTQ5MiAuODYwNzcyLTMuMzM1NDkyQy45NTY0MTMtMy4zMzU0OTIgLjk4MDMyNC0zLjQwNzIyMyAxLjAwNDIzNC0zLjQ1NTA0NEMxLjQxMDcxLTQuNzgyMDY3IDIuMjExNzA2LTUuMDMzMTI2IDIuNTU4NDA2LTUuMDMzMTI2QzMuMDk2Mzg5LTUuMDMzMTI2IDMuMjAzOTg1LTQuNTMxMDA5IDMuMjAzOTg1LTQuMjQ0MDg1QzMuMjAzOTg1LTMuOTgxMDcxIDMuMTMyMjU0LTMuNzA2MTAyIDIuOTg4NzkyLTMuMTMyMjU0TDIuNTgyMzE2LTEuNDk0Mzk2QzIuNDAyOTg5LS43NzcwODYgMi4wNTYyODktLjExOTU1MiAxLjQyMjY2NS0uMTE5NTUyQzEuMzYyODg5LS4xMTk1NTIgMS4wNjQwMS0uMTE5NTUyIC44MTI5NTEtLjI3NDk2OUMxLjI0MzMzNy0uMzU4NjU1IDEuMzM4OTc5LS43MTczMSAxLjMzODk3OS0uODYwNzcyQzEuMzM4OTc5LTEuMDk5ODc1IDEuMTU5NjUxLTEuMjQzMzM3IC45MzI1MDMtMS4yNDMzMzdDLjY0NTU3OS0xLjI0MzMzNyAuMzM0NzQ1LS45OTIyNzkgLjMzNDc0NS0uNjA5NzE0Qy4zMzQ3NDUtLjEwNzU5NyAuODk2NjM4IC4xMTk1NTIgMS40MTA3MSAuMTE5NTUyQzEuOTg0NTU4IC4xMTk1NTIgMi4zOTEwMzQtLjMzNDc0NSAyLjY0MjA5Mi0uODI0OTA3QzIuODMzMzc1LS4xMTk1NTIgMy40MzExMzMgLjExOTU1MiAzLjg3MzQ3NCAuMTE5NTUyQzUuMDkyOTAyIC4xMTk1NTIgNS43Mzg0ODEtMS40NDY1NzUgNS43Mzg0ODEtMS43MDk1ODlDNS43Mzg0ODEtMS43NjkzNjUgNS42OTA2Ni0xLjgxNzE4NiA1LjYxODkyOS0xLjgxNzE4NkM1LjUxMTMzMy0xLjgxNzE4NiA1LjQ5OTM3Ny0xLjc1NzQxIDUuNDYzNTEyLTEuNjYxNzY4QzUuMTQwNzIyLS42MDk3MTQgNC40NDczMjMtLjExOTU1MiAzLjkwOTM0LS4xMTk1NTJDMy40OTA5MDktLjExOTU1MiAzLjI2Mzc2MS0uNDMwMzg2IDMuMjYzNzYxLS45MjA1NDhDMy4yNjM3NjEtMS4xODM1NjIgMy4zMTE1ODItMS4zNzQ4NDQgMy41MDI4NjQtMi4xNjM4ODVMMy45MjEyOTUtMy43ODk3ODhDNC4xMDA2MjMtNC41MDcwOTggNC41MDcwOTgtNS4wMzMxMjYgNS4wNTcwMzYtNS4wMzMxMjZDNS4wODA5NDYtNS4wMzMxMjYgNS40MTU2OTEtNS4wMzMxMjYgNS42NjY3NS00Ljg3NzcwOVonLz4KPHBhdGggaWQ9J2czLTkxJyBkPSdNMi45ODg3OTIgMi45ODg3OTJWMi41NDY0NTFIMS44MjkxNDFWLTguNTI0MDM1SDIuOTg4NzkyVi04Ljk2NjM3NkgxLjM4NjhWMi45ODg3OTJIMi45ODg3OTJaJy8+CjxwYXRoIGlkPSdnMy05MycgZD0nTTEuODUzMDUxLTguOTY2Mzc2SC4yNTEwNTlWLTguNTI0MDM1SDEuNDEwNzFWMi41NDY0NTFILjI1MTA1OVYyLjk4ODc5MkgxLjg1MzA1MVYtOC45NjYzNzZaJy8+CjwvZGVmcz4KPGcgaWQ9J3BhZ2UxJz4KPHVzZSB4PScwJyB5PScwJyB4bGluazpocmVmPScjZzMtOTEnLz4KPHVzZSB4PSczLjI1MTY2MScgeT0nMCcgeGxpbms6aHJlZj0nI2cyLTEyMCcvPgo8dXNlIHg9JzkuOTAzNzQ4JyB5PSctNC4zMzg0MzcnIHhsaW5rOmhyZWY9JyNnMS0xMDknLz4KPHVzZSB4PScxNy4zOTQyNzUnIHk9Jy00LjMzODQzNycgeGxpbms6aHJlZj0nI2cxLTEwNScvPgo8dXNlIHg9JzIwLjI3NzQxNCcgeT0nLTQuMzM4NDM3JyB4bGluazpocmVmPScjZzEtMTEwJy8+Cjx1c2UgeD0nOS45MDM3NDgnIHk9JzIuOTU1NTE1JyB4bGluazpocmVmPScjZzEtMTA1Jy8+Cjx1c2UgeD0nMjUuOTEzNzQ5JyB5PScwJyB4bGluazpocmVmPScjZzItNTknLz4KPHVzZSB4PSczMS4xNTc5MDgnIHk9JzAnIHhsaW5rOmhyZWY9JyNnMi0xMjAnLz4KPHVzZSB4PSczNy44MDk5OTUnIHk9Jy00LjMzODQzNycgeGxpbms6aHJlZj0nI2cxLTEwOScvPgo8dXNlIHg9JzQ1LjMwMDUyMScgeT0nLTQuMzM4NDM3JyB4bGluazpocmVmPScjZzEtOTcnLz4KPHVzZSB4PSc0OS43OTg1MzEnIHk9Jy00LjMzODQzNycgeGxpbms6aHJlZj0nI2cxLTEyMCcvPgo8dXNlIHg9JzM3LjgwOTk5NScgeT0nMi45NTU1MTUnIHhsaW5rOmhyZWY9JyNnMS0xMDUnLz4KPHVzZSB4PSc1NS4wNjM1NjInIHk9JzAnIHhsaW5rOmhyZWY9JyNnMy05MycvPgo8dXNlIHg9JzYwLjk3MTg4NicgeT0nMCcgeGxpbms6aHJlZj0nI2cwLTInLz4KPHVzZSB4PSc3Mi45MjcwNDcnIHk9JzAnIHhsaW5rOmhyZWY9JyNnMy05MScvPgo8dXNlIHg9Jzc2LjE3ODcwOCcgeT0nMCcgeGxpbms6aHJlZj0nI2cyLTEyMCcvPgo8dXNlIHg9JzgyLjgzMDc5NScgeT0nLTQuMzM4NDM3JyB4bGluazpocmVmPScjZzEtMTA5Jy8+Cjx1c2UgeD0nOTAuMzIxMzIyJyB5PSctNC4zMzg0MzcnIHhsaW5rOmhyZWY9JyNnMS0xMDUnLz4KPHVzZSB4PSc5My4yMDQ0NjEnIHk9Jy00LjMzODQzNycgeGxpbms6aHJlZj0nI2cxLTExMCcvPgo8dXNlIHg9JzgyLjgzMDc5NScgeT0nMi45NTU1MTUnIHhsaW5rOmhyZWY9JyNnMS0xMDYnLz4KPHVzZSB4PSc5OC44NDA3OTYnIHk9JzAnIHhsaW5rOmhyZWY9JyNnMi01OScvPgo8dXNlIHg9JzEwNC4wODQ5NTUnIHk9JzAnIHhsaW5rOmhyZWY9JyNnMi0xMjAnLz4KPHVzZSB4PScxMTAuNzM3MDQyJyB5PSctNC4zMzg0MzcnIHhsaW5rOmhyZWY9JyNnMS0xMDknLz4KPHVzZSB4PScxMTguMjI3NTY4JyB5PSctNC4zMzg0MzcnIHhsaW5rOmhyZWY9JyNnMS05NycvPgo8dXNlIHg9JzEyMi43MjU1NzgnIHk9Jy00LjMzODQzNycgeGxpbms6aHJlZj0nI2cxLTEyMCcvPgo8dXNlIHg9JzExMC43MzcwNDInIHk9JzIuOTU1NTE1JyB4bGluazpocmVmPScjZzEtMTA2Jy8+Cjx1c2UgeD0nMTI3Ljk5MDYwOScgeT0nMCcgeGxpbms6aHJlZj0nI2czLTkzJy8+CjwvZz4KPC9zdmc+CjwhLS0gREVQVEg9NiAtLT4=) , when all the
other components of are fixed to the corresponding components of the
centralPoint .
Then OpenTURNS draws the graph:
, when all the
other components of are fixed to the corresponding components of the
centralPoint .
Then OpenTURNS draws the graph:
for any
![(s, t) \in [x_i^{min}, x_i^{max}] \times [x_j^{min}, x_j^{max}]](data:image/svg+xml;base64,PD94bWwgdmVyc2lvbj0nMS4wJyBlbmNvZGluZz0nVVRGLTgnPz4KPCEtLSBUaGlzIGZpbGUgd2FzIGdlbmVyYXRlZCBieSBkdmlzdmdtIDMuNC4yIC0tPgo8c3ZnIHZlcnNpb249JzEuMScgeG1sbnM9J2h0dHA6Ly93d3cudzMub3JnLzIwMDAvc3ZnJyB4bWxuczp4bGluaz0naHR0cDovL3d3dy53My5vcmcvMTk5OS94bGluaycgd2lkdGg9JzE2OS45NDQwNDNwdCcgaGVpZ2h0PScxNC4xMTI2MzVwdCcgdmlld0JveD0nMCAtOS42MDczNzQgMTY5Ljk0NDA0MyAxNC4xMTI2MzUnPgo8ZGVmcz4KPHBhdGggaWQ9J2cxLTk3JyBkPSdNMy4xMjQyODQtMy4wMzY2MTNDMy4wNTI1NTMtMy4xNzIxMDUgMi44MjE0Mi0zLjUxNDgxOSAyLjMzNTI0My0zLjUxNDgxOUMxLjM4NjgtMy41MTQ4MTkgLjM0MjcxNS0yLjQwNjk3NCAuMzQyNzE1LTEuMjI3Mzk3Qy4zNDI3MTUtLjM5ODUwNiAuODc2NzEyIC4wNzk3MDEgMS40OTA0MTEgLjA3OTcwMUMyLjAwMDQ5OCAuMDc5NzAxIDIuNDM4ODU0LS4zMjY3NzUgMi41ODIzMTYtLjQ4NjE3N0MyLjcyNTc3OCAuMDYzNzYxIDMuMjY3NzQ2IC4wNzk3MDEgMy4zNjMzODcgLjA3OTcwMUMzLjczMDAxMiAuMDc5NzAxIDMuOTEzMzI1LS4yMjMxNjMgMy45NzcwODYtLjM1ODY1NUM0LjEzNjQ4OC0uNjQ1NTc5IDQuMjQ4MDctMS4xMDc4NDYgNC4yNDgwNy0xLjEzOTcyNkM0LjI0ODA3LTEuMTg3NTQ3IDQuMjE2MTg5LTEuMjQzMzM3IDQuMTIwNTQ4LTEuMjQzMzM3UzQuMDA4OTY2LTEuMTk1NTE3IDMuOTYxMTQ2LS45OTYyNjRDMy44NDk1NjQtLjU1NzkwOCAzLjY5ODEzMi0uMTQzNDYyIDMuMzg3Mjk4LS4xNDM0NjJDMy4yMDM5ODUtLjE0MzQ2MiAzLjEzMjI1NC0uMjk0ODk0IDMuMTMyMjU0LS41MTgwNTdDMy4xMzIyNTQtLjY1MzU0OSAzLjIwMzk4NS0uOTI0NTMzIDMuMjUxODA2LTEuMTIzNzg2UzMuNDE5MTc4LTEuODAxMjQ1IDMuNDUxMDU5LTEuOTQ0NzA3TDMuNjEwNDYxLTIuNTUwNDM2QzMuNjUwMzExLTIuNzQxNzE5IDMuNzM3OTgzLTMuMDc2NDYzIDMuNzM3OTgzLTMuMTE2MzE0QzMuNzM3OTgzLTMuMjk5NjI2IDMuNTg2NTUtMy4zNjMzODcgMy40ODI5MzktMy4zNjMzODdDMy4zNjMzODctMy4zNjMzODcgMy4xNjQxMzQtMy4yODM2ODYgMy4xMjQyODQtMy4wMzY2MTNaTTIuNTgyMzE2LS44NjA3NzJDMi4xODM4MTEtLjMxMDgzNCAxLjc2OTM2NS0uMTQzNDYyIDEuNTE0MzIxLS4xNDM0NjJDMS4xNDc2OTYtLjE0MzQ2MiAuOTY0Mzg0LS40NzgyMDcgLjk2NDM4NC0uODkyNjUzQy45NjQzODQtMS4yNjcyNDggMS4xNzk1NzctMi4xMjAwNSAxLjM1NDkxOS0yLjQ3MDczNUMxLjU4NjA1Mi0yLjk1NjkxMiAxLjk3NjU4OC0zLjI5MTY1NiAyLjM0MzIxMy0zLjI5MTY1NkMyLjg2MTI3LTMuMjkxNjU2IDMuMDEyNzAyLTIuNzA5ODM4IDMuMDEyNzAyLTIuNjE0MTk3QzMuMDEyNzAyLTIuNTgyMzE2IDIuODEzNDUtMS44MDEyNDUgMi43NjU2MjktMS41OTQwMjJDMi42NjIwMTctMS4yMTk0MjcgMi42NjIwMTctMS4yMDM0ODcgMi41ODIzMTYtLjg2MDc3MlonLz4KPHBhdGggaWQ9J2cxLTEwNScgZD0nTTIuMzc1MDkzLTQuOTczMzVDMi4zNzUwOTMtNS4xNDg2OTIgMi4yNDc1NzItNS4yNzYyMTQgMi4wNjQyNTktNS4yNzYyMTRDMS44NTcwMzYtNS4yNzYyMTQgMS42MjU5MDMtNS4wODQ5MzIgMS42MjU5MDMtNC44NDU4MjhDMS42MjU5MDMtNC42NzA0ODYgMS43NTM0MjUtNC41NDI5NjQgMS45MzY3MzctNC41NDI5NjRDMi4xNDM5Ni00LjU0Mjk2NCAyLjM3NTA5My00LjczNDI0NyAyLjM3NTA5My00Ljk3MzM1Wk0xLjIxMTQ1Ny0yLjA0ODMxOUwuNzgxMDcxLS45NDg0NDNDLjc0MTIyLS44Mjg4OTIgLjcwMTM3LS43MzMyNSAuNzAxMzctLjU5Nzc1OEMuNzAxMzctLjIwNzIyMyAxLjAwNDIzNCAuMDc5NzAxIDEuNDI2NjUgLjA3OTcwMUMyLjE5OTc1MSAuMDc5NzAxIDIuNTI2NTI2LTEuMDM2MTE1IDIuNTI2NTI2LTEuMTM5NzI2QzIuNTI2NTI2LTEuMjE5NDI3IDIuNDYyNzY1LTEuMjQzMzM3IDIuNDA2OTc0LTEuMjQzMzM3QzIuMzExMzMzLTEuMjQzMzM3IDIuMjk1MzkyLTEuMTg3NTQ3IDIuMjcxNDgyLTEuMTA3ODQ2QzIuMDg4MTY5LS40NzAyMzcgMS43NjEzOTUtLjE0MzQ2MiAxLjQ0MjU5LS4xNDM0NjJDMS4zNDY5NDktLjE0MzQ2MiAxLjI1MTMwOC0uMTgzMzEzIDEuMjUxMzA4LS4zOTg1MDZDMS4yNTEzMDgtLjU4OTc4OCAxLjMwNzA5OC0uNzMzMjUgMS40MTA3MS0uOTgwMzI0QzEuNDkwNDExLTEuMTk1NTE3IDEuNTcwMTEyLTEuNDEwNzEgMS42NTc3ODMtMS42MjU5MDNMMS45MDQ4NTctMi4yNzE0ODJDMS45NzY1ODgtMi40NTQ3OTUgMi4wNzIyMjktMi43MDE4NjggMi4wNzIyMjktMi44MzczNkMyLjA3MjIyOS0zLjIzNTg2NiAxLjc1MzQyNS0zLjUxNDgxOSAxLjM0Njk0OS0zLjUxNDgxOUMuNTczODQ4LTMuNTE0ODE5IC4yMzkxMDMtMi4zOTkwMDQgLjIzOTEwMy0yLjI5NTM5MkMuMjM5MTAzLTIuMjIzNjYxIC4yOTQ4OTQtMi4xOTE3ODEgLjM1ODY1NS0yLjE5MTc4MUMuNDYyMjY3LTIuMTkxNzgxIC40NzAyMzctMi4yMzk2MDEgLjQ5NDE0Ny0yLjMxOTMwM0MuNzE3MzEtMy4wNzY0NjMgMS4wODM5MzUtMy4yOTE2NTYgMS4zMjMwMzktMy4yOTE2NTZDMS40MzQ2Mi0zLjI5MTY1NiAxLjUxNDMyMS0zLjI1MTgwNiAxLjUxNDMyMS0zLjAyODY0M0MxLjUxNDMyMS0yLjk0ODk0MSAxLjUwNjM1MS0yLjgzNzM2IDEuNDI2NjUtMi41OTgyNTdMMS4yMTE0NTctMi4wNDgzMTlaJy8+CjxwYXRoIGlkPSdnMS0xMDYnIGQ9J00zLjI5MTY1Ni00Ljk3MzM1QzMuMjkxNjU2LTUuMTI0NzgyIDMuMTcyMTA1LTUuMjc2MjE0IDIuOTgwODIyLTUuMjc2MjE0QzIuNzQxNzE5LTUuMjc2MjE0IDIuNTM0NDk2LTUuMDUzMDUxIDIuNTM0NDk2LTQuODQ1ODI4QzIuNTM0NDk2LTQuNjk0Mzk2IDIuNjU0MDQ3LTQuNTQyOTY0IDIuODQ1MzMtNC41NDI5NjRDMy4wODQ0MzMtNC41NDI5NjQgMy4yOTE2NTYtNC43NjYxMjcgMy4yOTE2NTYtNC45NzMzNVpNMS42MjU5MDMgLjM5ODUwNkMxLjUwNjM1MSAuODg0NjgyIDEuMTE1ODE2IDEuNDAyNzQgLjYyOTYzOSAxLjQwMjc0Qy41MDIxMTcgMS40MDI3NCAuMzgyNTY1IDEuMzcwODU5IC4zNjY2MjUgMS4zNjI4ODlDLjYxMzY5OSAxLjI0MzMzNyAuNjQ1NTc5IDEuMDI4MTQ0IC42NDU1NzkgLjk1NjQxM0MuNjQ1NTc5IC43NjUxMzEgLjUwMjExNyAuNjYxNTE5IC4zMzQ3NDUgLjY2MTUxOUMuMTAzNjExIC42NjE1MTktLjExMTU4MiAuODYwNzcyLS4xMTE1ODIgMS4xMjM3ODZDLS4xMTE1ODIgMS40MjY2NSAuMTgzMzEzIDEuNjI1OTAzIC42Mzc2MDkgMS42MjU5MDNDMS4xMjM3ODYgMS42MjU5MDMgMi4wMDA0OTggMS4zMjMwMzkgMi4yMzk2MDEgLjM2NjYyNUwyLjk1NjkxMi0yLjQ4NjY3NUMyLjk4MDgyMi0yLjU4MjMxNiAyLjk5Njc2Mi0yLjY0NjA3NyAyLjk5Njc2Mi0yLjc2NTYyOUMyLjk5Njc2Mi0zLjIwMzk4NSAyLjY0NjA3Ny0zLjUxNDgxOSAyLjE4MzgxMS0zLjUxNDgxOUMxLjMzODk3OS0zLjUxNDgxOSAuODQ0ODMyLTIuMzk5MDA0IC44NDQ4MzItMi4yOTUzOTJDLjg0NDgzMi0yLjIyMzY2MSAuOTAwNjIzLTIuMTkxNzgxIC45NjQzODQtMi4xOTE3ODFDMS4wNTIwNTUtMi4xOTE3ODEgMS4wNjAwMjUtMi4yMTU2OTEgMS4xMTU4MTYtMi4zMzUyNDNDMS4zNTQ5MTktMi44ODUxODEgMS43NjEzOTUtMy4yOTE2NTYgMi4xNTk5LTMuMjkxNjU2QzIuMzI3MjczLTMuMjkxNjU2IDIuNDIyOTE0LTMuMTgwMDc1IDIuNDIyOTE0LTIuOTE3MDYxQzIuNDIyOTE0LTIuODA1NDc5IDIuMzk5MDA0LTIuNjkzODk4IDIuMzc1MDkzLTIuNTgyMzE2TDEuNjI1OTAzIC4zOTg1MDZaJy8+CjxwYXRoIGlkPSdnMS0xMDknIGQ9J00xLjU5NDAyMi0xLjMwNzA5OEMxLjYxNzkzMy0xLjQyNjY1IDEuNjk3NjM0LTEuNzI5NTE0IDEuNzIxNTQ0LTEuODQ5MDY2QzEuNzQ1NDU1LTEuOTI4NzY3IDEuNzkzMjc1LTIuMTIwMDUgMS44MDkyMTUtMi4xOTk3NTFDMS44MjUxNTYtMi4yMzk2MDEgMi4wODgxNjktMi43NTc2NTkgMi40Mzg4NTQtMy4wMjA2NzJDMi43MDk4MzgtMy4yMjc4OTUgMi45NzI4NTItMy4yOTE2NTYgMy4xOTYwMTUtMy4yOTE2NTZDMy40OTA5MDktMy4yOTE2NTYgMy42NTAzMTEtMy4xMTYzMTQgMy42NTAzMTEtMi43NDk2ODlDMy42NTAzMTEtMi41NTg0MDYgMy42MDI0OTEtMi4zNzUwOTMgMy41MTQ4MTktMi4wMTY0MzhDMy40NTkwMjktMS44MDkyMTUgMy4zMjM1MzctMS4yNzUyMTggMy4yNzU3MTYtMS4wNjAwMjVMMy4xNTYxNjQtLjU4MTgxOEMzLjExNjMxNC0uNDQ2MzI2IDMuMDYwNTIzLS4yMDcyMjMgMy4wNjA1MjMtLjE2NzM3MkMzLjA2MDUyMyAuMDE1OTQgMy4yMTE5NTUgLjA3OTcwMSAzLjMxNTU2NyAuMDc5NzAxQzMuNDU5MDI5IC4wNzk3MDEgMy41Nzg1OC0uMDE1OTQgMy42MzQzNzEtLjExMTU4MkMzLjY1ODI4MS0uMTU5NDAyIDMuNzIyMDQyLS40MzAzODYgMy43NjE4OTMtLjU5Nzc1OEwzLjk0NTIwNS0xLjMwNzA5OEMzLjk2OTExNi0xLjQyNjY1IDQuMDQ4ODE3LTEuNzI5NTE0IDQuMDcyNzI3LTEuODQ5MDY2QzQuMTg0MzA5LTIuMjc5NDUyIDQuMTg0MzA5LTIuMjg3NDIyIDQuMzY3NjIxLTIuNTUwNDM2QzQuNjMwNjM1LTIuOTQwOTcxIDUuMDA1MjMtMy4yOTE2NTYgNS41MzkyMjgtMy4yOTE2NTZDNS44MjYxNTItMy4yOTE2NTYgNS45OTM1MjQtMy4xMjQyODQgNS45OTM1MjQtMi43NDk2ODlDNS45OTM1MjQtMi4zMTEzMzMgNS42NTg3OC0xLjM5NDc3IDUuNTA3MzQ3LTEuMDEyMjA0QzUuNDI3NjQ2LS44MDQ5ODEgNS40MDM3MzYtLjc0OTE5MSA1LjQwMzczNi0uNTk3NzU4QzUuNDAzNzM2LS4xNDM0NjIgNS43NzgzMzEgLjA3OTcwMSA2LjEyMTA0NiAuMDc5NzAxQzYuOTAyMTE3IC4wNzk3MDEgNy4yMjg4OTItMS4wMzYxMTUgNy4yMjg4OTItMS4xMzk3MjZDNy4yMjg4OTItMS4yMTk0MjcgNy4xNjUxMzEtMS4yNDMzMzcgNy4xMDkzNC0xLjI0MzMzN0M3LjAxMzY5OS0xLjI0MzMzNyA2Ljk5Nzc1OC0xLjE4NzU0NyA2Ljk3Mzg0OC0xLjEwNzg0NkM2Ljc4MjU2NS0uNDQ2MzI2IDYuNDQ3ODIxLS4xNDM0NjIgNi4xNDQ5NTYtLjE0MzQ2MkM2LjAxNzQzNS0uMTQzNDYyIDUuOTUzNjc0LS4yMjMxNjMgNS45NTM2NzQtLjQwNjQ3NlM2LjAxNzQzNS0uNzY1MTMxIDYuMDk3MTM2LS45NjQzODRDNi4yMTY2ODctMS4yNjcyNDggNi41NjczNzItMi4xODM4MTEgNi41NjczNzItMi42MzAxMzdDNi41NjczNzItMy4yMjc4OTUgNi4xNTI5MjctMy41MTQ4MTkgNS41NzkwNzgtMy41MTQ4MTlDNS4wMjkxNDEtMy41MTQ4MTkgNC41NzQ4NDQtMy4yMjc4OTUgNC4yMTYxODktMi43MzM3NDhDNC4xNTI0MjgtMy4zNzEzNTcgMy42NDIzNDEtMy41MTQ4MTkgMy4yMjc4OTUtMy41MTQ4MTlDMi44NjEyNy0zLjUxNDgxOSAyLjM3NTA5My0zLjM4NzI5OCAxLjkzNjczNy0yLjgxMzQ1QzEuODgwOTQ2LTMuMjkxNjU2IDEuNDk4MzgxLTMuNTE0ODE5IDEuMTIzNzg2LTMuNTE0ODE5Qy44NDQ4MzItMy41MTQ4MTkgLjY0NTU3OS0zLjM0NzQ0NyAuNTEwMDg3LTMuMDc2NDYzQy4zMTg4MDQtMi43MDE4NjggLjIzOTEwMy0yLjMxMTMzMyAuMjM5MTAzLTIuMjk1MzkyQy4yMzkxMDMtMi4yMjM2NjEgLjI5NDg5NC0yLjE5MTc4MSAuMzU4NjU1LTIuMTkxNzgxQy40NjIyNjctMi4xOTE3ODEgLjQ3MDIzNy0yLjIyMzY2MSAuNTI2MDI3LTIuNDMwODg0Qy42MjE2NjktMi44MjE0MiAuNzY1MTMxLTMuMjkxNjU2IDEuMDk5ODc1LTMuMjkxNjU2QzEuMzA3MDk4LTMuMjkxNjU2IDEuMzU0OTE5LTMuMDkyNDAzIDEuMzU0OTE5LTIuOTE3MDYxQzEuMzU0OTE5LTIuNzczNTk5IDEuMzE1MDY4LTIuNjIyMTY3IDEuMjUxMzA4LTIuMzU5MTUzQzEuMjM1MzY3LTIuMjk1MzkyIDEuMTE1ODE2LTEuODI1MTU2IDEuMDgzOTM1LTEuNzEzNTc0TC43ODkwNDEtLjUxODA1N0MuNzU3MTYxLS4zOTg1MDYgLjcwOTM0LS4xOTkyNTMgLjcwOTM0LS4xNjczNzJDLjcwOTM0IC4wMTU5NCAuODYwNzcyIC4wNzk3MDEgLjk2NDM4NCAuMDc5NzAxQzEuMTA3ODQ2IC4wNzk3MDEgMS4yMjczOTctLjAxNTk0IDEuMjgzMTg4LS4xMTE1ODJDMS4zMDcwOTgtLjE1OTQwMiAxLjM3MDg1OS0uNDMwMzg2IDEuNDEwNzEtLjU5Nzc1OEwxLjU5NDAyMi0xLjMwNzA5OFonLz4KPHBhdGggaWQ9J2cxLTExMCcgZD0nTTEuNTk0MDIyLTEuMzA3MDk4QzEuNjE3OTMzLTEuNDI2NjUgMS42OTc2MzQtMS43Mjk1MTQgMS43MjE1NDQtMS44NDkwNjZDMS44MzMxMjYtMi4yNzk0NTIgMS44MzMxMjYtMi4yODc0MjIgMi4wMTY0MzgtMi41NTA0MzZDMi4yNzk0NTItMi45NDA5NzEgMi42NTQwNDctMy4yOTE2NTYgMy4xODgwNDUtMy4yOTE2NTZDMy40NzQ5NjktMy4yOTE2NTYgMy42NDIzNDEtMy4xMjQyODQgMy42NDIzNDEtMi43NDk2ODlDMy42NDIzNDEtMi4zMTEzMzMgMy4zMDc1OTctMS40MDI3NCAzLjE1NjE2NC0xLjAxMjIwNEMzLjA1MjU1My0uNzQ5MTkxIDMuMDUyNTUzLS43MDEzNyAzLjA1MjU1My0uNTk3NzU4QzMuMDUyNTUzLS4xNDM0NjIgMy40MjcxNDggLjA3OTcwMSAzLjc2OTg2MyAuMDc5NzAxQzQuNTUwOTM0IC4wNzk3MDEgNC44Nzc3MDktMS4wMzYxMTUgNC44Nzc3MDktMS4xMzk3MjZDNC44Nzc3MDktMS4yMTk0MjcgNC44MTM5NDgtMS4yNDMzMzcgNC43NTgxNTctMS4yNDMzMzdDNC42NjI1MTYtMS4yNDMzMzcgNC42NDY1NzUtMS4xODc1NDcgNC42MjI2NjUtMS4xMDc4NDZDNC40MzEzODItLjQ1NDI5NiA0LjA5NjYzOC0uMTQzNDYyIDMuNzkzNzczLS4xNDM0NjJDMy42NjYyNTItLjE0MzQ2MiAzLjYwMjQ5MS0uMjIzMTYzIDMuNjAyNDkxLS40MDY0NzZTMy42NjYyNTItLjc2NTEzMSAzLjc0NTk1My0uOTY0Mzg0QzMuODY1NTA0LTEuMjY3MjQ4IDQuMjE2MTg5LTIuMTgzODExIDQuMjE2MTg5LTIuNjMwMTM3QzQuMjE2MTg5LTMuMjI3ODk1IDMuODAxNzQzLTMuNTE0ODE5IDMuMjI3ODk1LTMuNTE0ODE5QzIuNTgyMzE2LTMuNTE0ODE5IDIuMTY3ODctMy4xMjQyODQgMS45MzY3MzctMi44MjE0MkMxLjg4MDk0Ni0zLjI1OTc3NiAxLjUzMDI2Mi0zLjUxNDgxOSAxLjEyMzc4Ni0zLjUxNDgxOUMuODM2ODYyLTMuNTE0ODE5IC42Mzc2MDktMy4zMzE1MDcgLjUxMDA4Ny0zLjA4NDQzM0MuMzE4ODA0LTIuNzA5ODM4IC4yMzkxMDMtMi4zMTEzMzMgLjIzOTEwMy0yLjI5NTM5MkMuMjM5MTAzLTIuMjIzNjYxIC4yOTQ4OTQtMi4xOTE3ODEgLjM1ODY1NS0yLjE5MTc4MUMuNDYyMjY3LTIuMTkxNzgxIC40NzAyMzctMi4yMjM2NjEgLjUyNjAyNy0yLjQzMDg4NEMuNjIxNjY5LTIuODIxNDIgLjc2NTEzMS0zLjI5MTY1NiAxLjA5OTg3NS0zLjI5MTY1NkMxLjMwNzA5OC0zLjI5MTY1NiAxLjM1NDkxOS0zLjA5MjQwMyAxLjM1NDkxOS0yLjkxNzA2MUMxLjM1NDkxOS0yLjc3MzU5OSAxLjMxNTA2OC0yLjYyMjE2NyAxLjI1MTMwOC0yLjM1OTE1M0MxLjIzNTM2Ny0yLjI5NTM5MiAxLjExNTgxNi0xLjgyNTE1NiAxLjA4MzkzNS0xLjcxMzU3NEwuNzg5MDQxLS41MTgwNTdDLjc1NzE2MS0uMzk4NTA2IC43MDkzNC0uMTk5MjUzIC43MDkzNC0uMTY3MzcyQy43MDkzNCAuMDE1OTQgLjg2MDc3MiAuMDc5NzAxIC45NjQzODQgLjA3OTcwMUMxLjEwNzg0NiAuMDc5NzAxIDEuMjI3Mzk3LS4wMTU5NCAxLjI4MzE4OC0uMTExNTgyQzEuMzA3MDk4LS4xNTk0MDIgMS4zNzA4NTktLjQzMDM4NiAxLjQxMDcxLS41OTc3NThMMS41OTQwMjItMS4zMDcwOThaJy8+CjxwYXRoIGlkPSdnMS0xMjAnIGQ9J00zLjk5MzAyNi0zLjE4MDA3NUMzLjY0MjM0MS0zLjA5MjQwMyAzLjYyNjQwMS0yLjc4MTU2OSAzLjYyNjQwMS0yLjc0OTY4OUMzLjYyNjQwMS0yLjU3NDM0NiAzLjc2MTg5My0yLjQ1NDc5NSAzLjkzNzIzNS0yLjQ1NDc5NVM0LjM4MzU2Mi0yLjU5MDI4NiA0LjM4MzU2Mi0yLjkzMzAwMUM0LjM4MzU2Mi0zLjM4NzI5OCAzLjg4MTQ0NS0zLjUxNDgxOSAzLjU4NjU1LTMuNTE0ODE5QzMuMjExOTU1LTMuNTE0ODE5IDIuOTA5MDkxLTMuMjUxODA2IDIuNzI1Nzc4LTIuOTQwOTcxQzIuNTUwNDM2LTMuMzYzMzg3IDIuMTM1OTktMy41MTQ4MTkgMS44MDkyMTUtMy41MTQ4MTlDLjk0MDQ3My0zLjUxNDgxOSAuNDU0Mjk2LTIuNTE4NTU1IC40NTQyOTYtMi4yOTUzOTJDLjQ1NDI5Ni0yLjIyMzY2MSAuNTEwMDg3LTIuMTkxNzgxIC41NzM4NDgtMi4xOTE3ODFDLjY2OTQ4OS0yLjE5MTc4MSAuNjg1NDMtMi4yMzE2MzEgLjcwOTM0LTIuMzI3MjczQy44OTI2NTMtMi45MDkwOTEgMS4zNzA4NTktMy4yOTE2NTYgMS43ODUzMDUtMy4yOTE2NTZDMi4wOTYxMzktMy4yOTE2NTYgMi4yNDc1NzItMy4wNjg0OTMgMi4yNDc1NzItMi43ODE1NjlDMi4yNDc1NzItMi42MjIxNjcgMi4xNTE5My0yLjI1NTU0MiAyLjA4ODE2OS0yLjAwMDQ5OEMyLjAzMjM3OS0xLjc2OTM2NSAxLjg1NzAzNi0xLjA2MDAyNSAxLjgxNzE4Ni0uOTA4NTkzQzEuNzA1NjA0LS40NzgyMDcgMS40MTg2OC0uMTQzNDYyIDEuMDYwMDI1LS4xNDM0NjJDMS4wMjgxNDQtLjE0MzQ2MiAuODIwOTIyLS4xNDM0NjIgLjY1MzU0OS0uMjU1MDQ0QzEuMDIwMTc0LS4zNDI3MTUgMS4wMjAxNzQtLjY3NzQ2IDEuMDIwMTc0LS42ODU0M0MxLjAyMDE3NC0uODY4NzQyIC44NzY3MTItLjk4MDMyNCAuNzAxMzctLjk4MDMyNEMuNDg2MTc3LS45ODAzMjQgLjI1NTA0NC0uNzk3MDExIC4yNTUwNDQtLjQ5NDE0N0MuMjU1MDQ0LS4xMjc1MjIgLjY0NTU3OSAuMDc5NzAxIDEuMDUyMDU1IC4wNzk3MDFDMS40NzQ0NzEgLjA3OTcwMSAxLjc2OTM2NS0uMjM5MTAzIDEuOTEyODI3LS40OTQxNDdDMi4wODgxNjktLjEwMzYxMSAyLjQ1NDc5NSAuMDc5NzAxIDIuODM3MzYgLjA3OTcwMUMzLjcwNjEwMiAuMDc5NzAxIDQuMTg0MzA5LS45MTY1NjMgNC4xODQzMDktMS4xMzk3MjZDNC4xODQzMDktMS4yMTk0MjcgNC4xMjA1NDgtMS4yNDMzMzcgNC4wNjQ3NTctMS4yNDMzMzdDMy45NjkxMTYtMS4yNDMzMzcgMy45NTMxNzYtMS4xODc1NDcgMy45MjkyNjUtMS4xMDc4NDZDMy43Njk4NjMtLjU3Mzg0OCAzLjMxNTU2Ny0uMTQzNDYyIDIuODUzMy0uMTQzNDYyQzIuNTkwMjg2LS4xNDM0NjIgMi4zOTkwMDQtLjMxODgwNCAyLjM5OTAwNC0uNjUzNTQ5QzIuMzk5MDA0LS44MTI5NTEgMi40NDY4MjQtLjk5NjI2NCAyLjU1ODQwNi0xLjQ0MjU5QzIuNjE0MTk3LTEuNjgxNjk0IDIuNzg5NTM5LTIuMzgzMDY0IDIuODI5MzktMi41MzQ0OTZDMi45NDA5NzEtMi45NDg5NDEgMy4yMTk5MjUtMy4yOTE2NTYgMy41Nzg1OC0zLjI5MTY1NkMzLjYxODQzMS0zLjI5MTY1NiAzLjgyNTY1NC0zLjI5MTY1NiAzLjk5MzAyNi0zLjE4MDA3NVonLz4KPHBhdGggaWQ9J2cwLTInIGQ9J000LjY1MDU2LTMuMzIzNTM3TDIuMjU5NTI3LTUuNzAyNjE1QzIuMTE2MDY1LTUuODQ2MDc3IDIuMDkyMTU0LTUuODY5OTg4IDEuOTk2NTEzLTUuODY5OTg4QzEuODc2OTYxLTUuODY5OTg4IDEuNzU3NDEtNS43NjIzOTEgMS43NTc0MS01LjYzMDg4NEMxLjc1NzQxLTUuNTQ3MTk4IDEuNzgxMzItNS41MjMyODggMS45MTI4MjctNS4zOTE3ODFMNC4zMDM4NjEtMi45ODg3OTJMMS45MTI4MjctLjU4NTgwM0MxLjc4MTMyLS40NTQyOTYgMS43NTc0MS0uNDMwMzg2IDEuNzU3NDEtLjM0NjdDMS43NTc0MS0uMjE1MTkzIDEuODc2OTYxLS4xMDc1OTcgMS45OTY1MTMtLjEwNzU5N0MyLjA5MjE1NC0uMTA3NTk3IDIuMTE2MDY1LS4xMzE1MDcgMi4yNTk1MjctLjI3NDk2OUw0LjYzODYwNS0yLjY1NDA0N0w3LjExMzMyNS0uMTc5MzI4QzcuMTM3MjM1LS4xNjczNzIgNy4yMjA5MjItLjEwNzU5NyA3LjI5MjY1My0uMTA3NTk3QzcuNDM2MTE1LS4xMDc1OTcgNy41MzE3NTYtLjIxNTE5MyA3LjUzMTc1Ni0uMzQ2N0M3LjUzMTc1Ni0uMzcwNjEgNy41MzE3NTYtLjQxODQzMSA3LjQ5NTg5LS40NzgyMDdDNy40ODM5MzUtLjUwMjExNyA1LjU4MzA2NC0yLjM3OTA3OCA0Ljk4NTMwNS0yLjk4ODc5Mkw3LjE3MzEwMS01LjE3NjU4OEM3LjIzMjg3Ny01LjI0ODMxOSA3LjQxMjIwNC01LjQwMzczNiA3LjQ3MTk4LTUuNDc1NDY3QzcuNDgzOTM1LTUuNDk5Mzc3IDcuNTMxNzU2LTUuNTQ3MTk4IDcuNTMxNzU2LTUuNjMwODg0QzcuNTMxNzU2LTUuNzYyMzkxIDcuNDM2MTE1LTUuODY5OTg4IDcuMjkyNjUzLTUuODY5OTg4QzcuMTk3MDExLTUuODY5OTg4IDcuMTQ5MTkxLTUuODIyMTY3IDcuMDE3Njg0LTUuNjkwNjZMNC42NTA1Ni0zLjMyMzUzN1onLz4KPHBhdGggaWQ9J2cwLTUwJyBkPSdNNi41NTE0MzItMi43NDk2ODlDNi43NTQ2Ny0yLjc0OTY4OSA2Ljk2OTg2My0yLjc0OTY4OSA2Ljk2OTg2My0yLjk4ODc5MlM2Ljc1NDY3LTMuMjI3ODk1IDYuNTUxNDMyLTMuMjI3ODk1SDEuNDgyNDQxQzEuNjI1OTAzLTQuODI5ODg4IDMuMDAwNzQ3LTUuOTc3NTg0IDQuNjg2NDI2LTUuOTc3NTg0SDYuNTUxNDMyQzYuNzU0NjctNS45Nzc1ODQgNi45Njk4NjMtNS45Nzc1ODQgNi45Njk4NjMtNi4yMTY2ODdTNi43NTQ2Ny02LjQ1NTc5MSA2LjU1MTQzMi02LjQ1NTc5MUg0LjY2MjUxNkMyLjYxODE4Mi02LjQ1NTc5MSAuOTkyMjc5LTQuOTAxNjE5IC45OTIyNzktMi45ODg3OTJTMi42MTgxODIgLjQ3ODIwNyA0LjY2MjUxNiAuNDc4MjA3SDYuNTUxNDMyQzYuNzU0NjcgLjQ3ODIwNyA2Ljk2OTg2MyAuNDc4MjA3IDYuOTY5ODYzIC4yMzkxMDNTNi43NTQ2NyAwIDYuNTUxNDMyIDBINC42ODY0MjZDMy4wMDA3NDcgMCAxLjYyNTkwMy0xLjE0NzY5NiAxLjQ4MjQ0MS0yLjc0OTY4OUg2LjU1MTQzMlonLz4KPHBhdGggaWQ9J2cyLTU5JyBkPSdNMi4zMzEyNTggLjA0NzgyMUMyLjMzMTI1OC0uNjQ1NTc5IDIuMTA0MTEtMS4xNTk2NTEgMS42MTM5NDgtMS4xNTk2NTFDMS4yMzEzODItMS4xNTk2NTEgMS4wNDAxLS44NDg4MTcgMS4wNDAxLS41ODU4MDNTMS4yMTk0MjcgMCAxLjYyNTkwMyAwQzEuNzgxMzIgMCAxLjkxMjgyNy0uMDQ3ODIxIDIuMDIwNDIzLS4xNTU0MTdDMi4wNDQzMzQtLjE3OTMyOCAyLjA1NjI4OS0uMTc5MzI4IDIuMDY4MjQ0LS4xNzkzMjhDMi4wOTIxNTQtLjE3OTMyOCAyLjA5MjE1NC0uMDExOTU1IDIuMDkyMTU0IC4wNDc4MjFDMi4wOTIxNTQgLjQ0MjM0MSAyLjAyMDQyMyAxLjIxOTQyNyAxLjMyNzAyNCAxLjk5NjUxM0MxLjE5NTUxNyAyLjEzOTk3NSAxLjE5NTUxNyAyLjE2Mzg4NSAxLjE5NTUxNyAyLjE4Nzc5NkMxLjE5NTUxNyAyLjI0NzU3MiAxLjI1NTI5MyAyLjMwNzM0NyAxLjMxNTA2OCAyLjMwNzM0N0MxLjQxMDcxIDIuMzA3MzQ3IDIuMzMxMjU4IDEuNDIyNjY1IDIuMzMxMjU4IC4wNDc4MjFaJy8+CjxwYXRoIGlkPSdnMi0xMTUnIGQ9J00yLjcyNTc3OC0yLjM5MTAzNEMyLjkyOTAxNi0yLjM1NTE2OCAzLjI1MTgwNi0yLjI4MzQzNyAzLjMyMzUzNy0yLjI3MTQ4MkMzLjQ3ODk1NC0yLjIyMzY2MSA0LjAxNjkzNi0yLjAzMjM3OSA0LjAxNjkzNi0xLjQ1ODUzMUM0LjAxNjkzNi0xLjA4NzkyIDMuNjgyMTkyLS4xMTk1NTIgMi4yOTUzOTItLjExOTU1MkMyLjA0NDMzNC0uMTE5NTUyIDEuMTQ3Njk2LS4xNTU0MTcgLjkwODU5My0uODEyOTUxQzEuMzg2OC0uNzUzMTc2IDEuNjI1OTAzLTEuMTIzNzg2IDEuNjI1OTAzLTEuMzg2OEMxLjYyNTkwMy0xLjYzNzg1OCAxLjQ1ODUzMS0xLjc2OTM2NSAxLjIxOTQyNy0xLjc2OTM2NUMuOTU2NDEzLTEuNzY5MzY1IC42MDk3MTQtMS41NjYxMjcgLjYwOTcxNC0xLjAyODE0NEMuNjA5NzE0LS4zMjI3OSAxLjMyNzAyNCAuMTE5NTUyIDIuMjgzNDM3IC4xMTk1NTJDNC4xMDA2MjMgLjExOTU1MiA0LjYzODYwNS0xLjIxOTQyNyA0LjYzODYwNS0xLjg0MTA5NkM0LjYzODYwNS0yLjAyMDQyMyA0LjYzODYwNS0yLjM1NTE2OCA0LjI1NjA0LTIuNzM3NzMzQzMuOTU3MTYxLTMuMDI0NjU4IDMuNjcwMjM3LTMuMDg0NDMzIDMuMDI0NjU4LTMuMjE1OTRDMi43MDE4NjgtMy4yODc2NzEgMi4xODc3OTYtMy4zOTUyNjggMi4xODc3OTYtMy45MzMyNUMyLjE4Nzc5Ni00LjE3MjM1NCAyLjQwMjk4OS01LjAzMzEyNiAzLjUzODczLTUuMDMzMTI2QzQuMDQwODQ3LTUuMDMzMTI2IDQuNTMxMDA5LTQuODQxODQzIDQuNjUwNTYtNC40MTE0NTdDNC4xMjQ1MzMtNC40MTE0NTcgNC4xMDA2MjMtMy45NTcxNjEgNC4xMDA2MjMtMy45NDUyMDVDNC4xMDA2MjMtMy42OTQxNDcgNC4zMjc3NzEtMy42MjI0MTYgNC40MzUzNjctMy42MjI0MTZDNC42MDI3NC0zLjYyMjQxNiA0LjkzNzQ4NC0zLjc1MzkyMyA0LjkzNzQ4NC00LjI1NjA0UzQuNDgzMTg4LTUuMjcyMjI5IDMuNTUwNjg1LTUuMjcyMjI5QzEuOTg0NTU4LTUuMjcyMjI5IDEuNTY2MTI3LTQuMDQwODQ3IDEuNTY2MTI3LTMuNTUwNjg1QzEuNTY2MTI3LTIuNjQyMDkyIDIuNDUwODA5LTIuNDUwODA5IDIuNzI1Nzc4LTIuMzkxMDM0WicvPgo8cGF0aCBpZD0nZzItMTE2JyBkPSdNMi40MDI5ODktNC44MDU5NzhIMy41MDI4NjRDMy43MzAwMTItNC44MDU5NzggMy44NDk1NjQtNC44MDU5NzggMy44NDk1NjQtNS4wMjExNzFDMy44NDk1NjQtNS4xNTI2NzcgMy43Nzc4MzMtNS4xNTI2NzcgMy41Mzg3My01LjE1MjY3N0gyLjQ4NjY3NUwyLjkyOTAxNi02Ljg5ODEzMkMyLjk3NjgzNy03LjA2NTUwNCAyLjk3NjgzNy03LjA4OTQxNSAyLjk3NjgzNy03LjE3MzEwMUMyLjk3NjgzNy03LjM2NDM4NCAyLjgyMTQyLTcuNDcxOTggMi42NjYwMDItNy40NzE5OEMyLjU3MDM2MS03LjQ3MTk4IDIuMjk1MzkyLTcuNDM2MTE1IDIuMTk5NzUxLTcuMDUzNTQ5TDEuNzMzNDk5LTUuMTUyNjc3SC42MDk3MTRDLjM3MDYxLTUuMTUyNjc3IC4yNjMwMTQtNS4xNTI2NzcgLjI2MzAxNC00LjkyNTUyOUMuMjYzMDE0LTQuODA1OTc4IC4zNDY3LTQuODA1OTc4IC41NzM4NDgtNC44MDU5NzhIMS42Mzc4NThMLjg0ODgxNy0xLjY0OTgxM0MuNzUzMTc2LTEuMjMxMzgyIC43MTczMS0xLjExMTgzMSAuNzE3MzEtLjk1NjQxM0MuNzE3MzEtLjM5NDUyMSAxLjExMTgzMSAuMTE5NTUyIDEuNzgxMzIgLjExOTU1MkMyLjk4ODc5MiAuMTE5NTUyIDMuNjM0MzcxLTEuNjI1OTAzIDMuNjM0MzcxLTEuNzA5NTg5QzMuNjM0MzcxLTEuNzgxMzIgMy41ODY1NS0xLjgxNzE4NiAzLjUxNDgxOS0xLjgxNzE4NkMzLjQ5MDkwOS0xLjgxNzE4NiAzLjQ0MzA4OC0xLjgxNzE4NiAzLjQxOTE3OC0xLjc2OTM2NUMzLjQwNzIyMy0xLjc1NzQxIDMuMzk1MjY4LTEuNzQ1NDU1IDMuMzExNTgyLTEuNTU0MTcyQzMuMDYwNTIzLS45NTY0MTMgMi41MTA1ODUtLjExOTU1MiAxLjgxNzE4Ni0uMTE5NTUyQzEuNDU4NTMxLS4xMTk1NTIgMS40MzQ2Mi0uNDE4NDMxIDEuNDM0NjItLjY4MTQ0NUMxLjQzNDYyLS42OTM0IDEuNDM0NjItLjkyMDU0OCAxLjQ3MDQ4Ni0xLjA2NDAxTDIuNDAyOTg5LTQuODA1OTc4WicvPgo8cGF0aCBpZD0nZzItMTIwJyBkPSdNNS42NjY3NS00Ljg3NzcwOUM1LjI4NDE4NC00LjgwNTk3OCA1LjE0MDcyMi00LjUxOTA1NCA1LjE0MDcyMi00LjI5MTkwNUM1LjE0MDcyMi00LjAwNDk4MSA1LjM2Nzg3LTMuOTA5MzQgNS41MzUyNDMtMy45MDkzNEM1Ljg5Mzg5OC0zLjkwOTM0IDYuMTQ0OTU2LTQuMjIwMTc0IDYuMTQ0OTU2LTQuNTQyOTY0QzYuMTQ0OTU2LTUuMDQ1MDgxIDUuNTcxMTA4LTUuMjcyMjI5IDUuMDY4OTkxLTUuMjcyMjI5QzQuMzM5NzI2LTUuMjcyMjI5IDMuOTMzMjUtNC41NTQ5MTkgMy44MjU2NTQtNC4zMjc3NzFDMy41NTA2ODUtNS4yMjQ0MDggMi44MDk0NjUtNS4yNzIyMjkgMi41OTQyNzEtNS4yNzIyMjlDMS4zNzQ4NDQtNS4yNzIyMjkgLjcyOTI2NS0zLjcwNjEwMiAuNzI5MjY1LTMuNDQzMDg4Qy43MjkyNjUtMy4zOTUyNjggLjc3NzA4Ni0zLjMzNTQ5MiAuODYwNzcyLTMuMzM1NDkyQy45NTY0MTMtMy4zMzU0OTIgLjk4MDMyNC0zLjQwNzIyMyAxLjAwNDIzNC0zLjQ1NTA0NEMxLjQxMDcxLTQuNzgyMDY3IDIuMjExNzA2LTUuMDMzMTI2IDIuNTU4NDA2LTUuMDMzMTI2QzMuMDk2Mzg5LTUuMDMzMTI2IDMuMjAzOTg1LTQuNTMxMDA5IDMuMjAzOTg1LTQuMjQ0MDg1QzMuMjAzOTg1LTMuOTgxMDcxIDMuMTMyMjU0LTMuNzA2MTAyIDIuOTg4NzkyLTMuMTMyMjU0TDIuNTgyMzE2LTEuNDk0Mzk2QzIuNDAyOTg5LS43NzcwODYgMi4wNTYyODktLjExOTU1MiAxLjQyMjY2NS0uMTE5NTUyQzEuMzYyODg5LS4xMTk1NTIgMS4wNjQwMS0uMTE5NTUyIC44MTI5NTEtLjI3NDk2OUMxLjI0MzMzNy0uMzU4NjU1IDEuMzM4OTc5LS43MTczMSAxLjMzODk3OS0uODYwNzcyQzEuMzM4OTc5LTEuMDk5ODc1IDEuMTU5NjUxLTEuMjQzMzM3IC45MzI1MDMtMS4yNDMzMzdDLjY0NTU3OS0xLjI0MzMzNyAuMzM0NzQ1LS45OTIyNzkgLjMzNDc0NS0uNjA5NzE0Qy4zMzQ3NDUtLjEwNzU5NyAuODk2NjM4IC4xMTk1NTIgMS40MTA3MSAuMTE5NTUyQzEuOTg0NTU4IC4xMTk1NTIgMi4zOTEwMzQtLjMzNDc0NSAyLjY0MjA5Mi0uODI0OTA3QzIuODMzMzc1LS4xMTk1NTIgMy40MzExMzMgLjExOTU1MiAzLjg3MzQ3NCAuMTE5NTUyQzUuMDkyOTAyIC4xMTk1NTIgNS43Mzg0ODEtMS40NDY1NzUgNS43Mzg0ODEtMS43MDk1ODlDNS43Mzg0ODEtMS43NjkzNjUgNS42OTA2Ni0xLjgxNzE4NiA1LjYxODkyOS0xLjgxNzE4NkM1LjUxMTMzMy0xLjgxNzE4NiA1LjQ5OTM3Ny0xLjc1NzQxIDUuNDYzNTEyLTEuNjYxNzY4QzUuMTQwNzIyLS42MDk3MTQgNC40NDczMjMtLjExOTU1MiAzLjkwOTM0LS4xMTk1NTJDMy40OTA5MDktLjExOTU1MiAzLjI2Mzc2MS0uNDMwMzg2IDMuMjYzNzYxLS45MjA1NDhDMy4yNjM3NjEtMS4xODM1NjIgMy4zMTE1ODItMS4zNzQ4NDQgMy41MDI4NjQtMi4xNjM4ODVMMy45MjEyOTUtMy43ODk3ODhDNC4xMDA2MjMtNC41MDcwOTggNC41MDcwOTgtNS4wMzMxMjYgNS4wNTcwMzYtNS4wMzMxMjZDNS4wODA5NDYtNS4wMzMxMjYgNS40MTU2OTEtNS4wMzMxMjYgNS42NjY3NS00Ljg3NzcwOVonLz4KPHBhdGggaWQ9J2czLTQwJyBkPSdNMy44ODU0MyAyLjkwNTEwNkMzLjg4NTQzIDIuODY5MjQgMy44ODU0MyAyLjg0NTMzIDMuNjgyMTkyIDIuNjQyMDkyQzIuNDg2Njc1IDEuNDM0NjIgMS44MTcxODYtLjUzNzk4MyAxLjgxNzE4Ni0yLjk3NjgzN0MxLjgxNzE4Ni01LjI5NjEzOSAyLjM3OTA3OC03LjI5MjY1MyAzLjc2NTg3OC04LjcwMzM2MkMzLjg4NTQzLTguODEwOTU5IDMuODg1NDMtOC44MzQ4NjkgMy44ODU0My04Ljg3MDczNUMzLjg4NTQzLTguOTQyNDY2IDMuODI1NjU0LTguOTY2Mzc2IDMuNzc3ODMzLTguOTY2Mzc2QzMuNjIyNDE2LTguOTY2Mzc2IDIuNjQyMDkyLTguMTA1NjA0IDIuMDU2Mjg5LTYuOTMzOTk4QzEuNDQ2NTc1LTUuNzI2NTI2IDEuMTcxNjA2LTQuNDQ3MzIzIDEuMTcxNjA2LTIuOTc2ODM3QzEuMTcxNjA2LTEuOTEyODI3IDEuMzM4OTc5LS40OTAxNjIgMS45NjA2NDggLjc4OTA0MUMyLjY2NjAwMiAyLjIyMzY2MSAzLjY0NjMyNiAzLjAwMDc0NyAzLjc3NzgzMyAzLjAwMDc0N0MzLjgyNTY1NCAzLjAwMDc0NyAzLjg4NTQzIDIuOTc2ODM3IDMuODg1NDMgMi45MDUxMDZaJy8+CjxwYXRoIGlkPSdnMy00MScgZD0nTTMuMzcxMzU3LTIuOTc2ODM3QzMuMzcxMzU3LTMuODg1NDMgMy4yNTE4MDYtNS4zNjc4NyAyLjU4MjMxNi02Ljc1NDY3QzEuODc2OTYxLTguMTg5MjkgLjg5NjYzOC04Ljk2NjM3NiAuNzY1MTMxLTguOTY2Mzc2Qy43MTczMS04Ljk2NjM3NiAuNjU3NTM0LTguOTQyNDY2IC42NTc1MzQtOC44NzA3MzVDLjY1NzUzNC04LjgzNDg2OSAuNjU3NTM0LTguODEwOTU5IC44NjA3NzItOC42MDc3MjFDMi4wNTYyODktNy40MDAyNDkgMi43MjU3NzgtNS40Mjc2NDYgMi43MjU3NzgtMi45ODg3OTJDMi43MjU3NzgtLjY2OTQ4OSAyLjE2Mzg4NSAxLjMyNzAyNCAuNzc3MDg2IDIuNzM3NzMzQy42NTc1MzQgMi44NDUzMyAuNjU3NTM0IDIuODY5MjQgLjY1NzUzNCAyLjkwNTEwNkMuNjU3NTM0IDIuOTc2ODM3IC43MTczMSAzLjAwMDc0NyAuNzY1MTMxIDMuMDAwNzQ3Qy45MjA1NDggMy4wMDA3NDcgMS45MDA4NzIgMi4xMzk5NzUgMi40ODY2NzUgLjk2ODM2OUMzLjA5NjM4OS0uMjUxMDU5IDMuMzcxMzU3LTEuNTQyMjE3IDMuMzcxMzU3LTIuOTc2ODM3WicvPgo8cGF0aCBpZD0nZzMtOTEnIGQ9J00yLjk4ODc5MiAyLjk4ODc5MlYyLjU0NjQ1MUgxLjgyOTE0MVYtOC41MjQwMzVIMi45ODg3OTJWLTguOTY2Mzc2SDEuMzg2OFYyLjk4ODc5MkgyLjk4ODc5MlonLz4KPHBhdGggaWQ9J2czLTkzJyBkPSdNMS44NTMwNTEtOC45NjYzNzZILjI1MTA1OVYtOC41MjQwMzVIMS40MTA3MVYyLjU0NjQ1MUguMjUxMDU5VjIuOTg4NzkySDEuODUzMDUxVi04Ljk2NjM3NlonLz4KPC9kZWZzPgo8ZyBpZD0ncGFnZTEnPgo8dXNlIHg9JzAnIHk9JzAnIHhsaW5rOmhyZWY9JyNnMy00MCcvPgo8dXNlIHg9JzQuNTUyMzI2JyB5PScwJyB4bGluazpocmVmPScjZzItMTE1Jy8+Cjx1c2UgeD0nMTAuMDY2MzMxJyB5PScwJyB4bGluazpocmVmPScjZzItNTknLz4KPHVzZSB4PScxNS4zMTA0OScgeT0nMCcgeGxpbms6aHJlZj0nI2cyLTExNicvPgo8dXNlIHg9JzE5LjUzNzY1JyB5PScwJyB4bGluazpocmVmPScjZzMtNDEnLz4KPHVzZSB4PScyNy40MTA4MDUnIHk9JzAnIHhsaW5rOmhyZWY9JyNnMC01MCcvPgo8dXNlIHg9JzM4LjcwMTc3MycgeT0nMCcgeGxpbms6aHJlZj0nI2czLTkxJy8+Cjx1c2UgeD0nNDEuOTUzNDM0JyB5PScwJyB4bGluazpocmVmPScjZzItMTIwJy8+Cjx1c2UgeD0nNDguNjA1NTIyJyB5PSctNC4zMzg0MzcnIHhsaW5rOmhyZWY9JyNnMS0xMDknLz4KPHVzZSB4PSc1Ni4wOTYwNDgnIHk9Jy00LjMzODQzNycgeGxpbms6aHJlZj0nI2cxLTEwNScvPgo8dXNlIHg9JzU4Ljk3OTE4NycgeT0nLTQuMzM4NDM3JyB4bGluazpocmVmPScjZzEtMTEwJy8+Cjx1c2UgeD0nNDguNjA1NTIyJyB5PScyLjk1NTUxNScgeGxpbms6aHJlZj0nI2cxLTEwNScvPgo8dXNlIHg9JzY0LjYxNTUyMicgeT0nMCcgeGxpbms6aHJlZj0nI2cyLTU5Jy8+Cjx1c2UgeD0nNjkuODU5NjgxJyB5PScwJyB4bGluazpocmVmPScjZzItMTIwJy8+Cjx1c2UgeD0nNzYuNTExNzY4JyB5PSctNC4zMzg0MzcnIHhsaW5rOmhyZWY9JyNnMS0xMDknLz4KPHVzZSB4PSc4NC4wMDIyOTQnIHk9Jy00LjMzODQzNycgeGxpbms6aHJlZj0nI2cxLTk3Jy8+Cjx1c2UgeD0nODguNTAwMzA0JyB5PSctNC4zMzg0MzcnIHhsaW5rOmhyZWY9JyNnMS0xMjAnLz4KPHVzZSB4PSc3Ni41MTE3NjgnIHk9JzIuOTU1NTE1JyB4bGluazpocmVmPScjZzEtMTA1Jy8+Cjx1c2UgeD0nOTMuNzY1MzM1JyB5PScwJyB4bGluazpocmVmPScjZzMtOTMnLz4KPHVzZSB4PSc5OS42NzM2NicgeT0nMCcgeGxpbms6aHJlZj0nI2cwLTInLz4KPHVzZSB4PScxMTEuNjI4ODInIHk9JzAnIHhsaW5rOmhyZWY9JyNnMy05MScvPgo8dXNlIHg9JzExNC44ODA0ODEnIHk9JzAnIHhsaW5rOmhyZWY9JyNnMi0xMjAnLz4KPHVzZSB4PScxMjEuNTMyNTY4JyB5PSctNC4zMzg0MzcnIHhsaW5rOmhyZWY9JyNnMS0xMDknLz4KPHVzZSB4PScxMjkuMDIzMDk1JyB5PSctNC4zMzg0MzcnIHhsaW5rOmhyZWY9JyNnMS0xMDUnLz4KPHVzZSB4PScxMzEuOTA2MjM0JyB5PSctNC4zMzg0MzcnIHhsaW5rOmhyZWY9JyNnMS0xMTAnLz4KPHVzZSB4PScxMjEuNTMyNTY4JyB5PScyLjk1NTUxNScgeGxpbms6aHJlZj0nI2cxLTEwNicvPgo8dXNlIHg9JzEzNy41NDI1NjknIHk9JzAnIHhsaW5rOmhyZWY9JyNnMi01OScvPgo8dXNlIHg9JzE0Mi43ODY3MjgnIHk9JzAnIHhsaW5rOmhyZWY9JyNnMi0xMjAnLz4KPHVzZSB4PScxNDkuNDM4ODE1JyB5PSctNC4zMzg0MzcnIHhsaW5rOmhyZWY9JyNnMS0xMDknLz4KPHVzZSB4PScxNTYuOTI5MzQxJyB5PSctNC4zMzg0MzcnIHhsaW5rOmhyZWY9JyNnMS05NycvPgo8dXNlIHg9JzE2MS40MjczNTEnIHk9Jy00LjMzODQzNycgeGxpbms6aHJlZj0nI2cxLTEyMCcvPgo8dXNlIHg9JzE0OS40Mzg4MTUnIHk9JzIuOTU1NTE1JyB4bGluazpocmVmPScjZzEtMTA2Jy8+Cjx1c2UgeD0nMTY2LjY5MjM4MicgeT0nMCcgeGxpbms6aHJlZj0nI2czLTkzJy8+CjwvZz4KPC9zdmc+CjwhLS0gREVQVEg9NiAtLT4=) where
where  is defined by the equation:
In the third usage:
The same as the first usage but only for function
 .
.In the fourth usage:
The same as the second usage but only for function
 .
.Examples
>>> import openturns as ot
>>> from openturns.viewer import View
>>> f = ot.SymbolicFunction('x', 'sin(2*pi_*x)*exp(-x^2/2)')
>>> graph = f.draw(-1.2, 1.2, 100)
>>> View(graph).show()
- drawCrossCuts(*args)
Draw the 2D and 1D cross cuts of a 1D output function as a
GridLayout.- Parameters:
- centralPointlist of float
Central point with dimension equal to the input dimension of the function.
- xMin, xMaxlist of float
Define the interval where the curve is plotted.
- pointNumber
Indices The number of points to draw the contours and the curves.
- withMonoDimensionalCutsbool, optional
withMonoDimensionalCuts indicates whether the mono dimension cuts are drawn or not Default value is specified in the CrossCuts-DefaultWithMonoDimensionalCuts ResourceMap key.
- isFilledbool, optional
isFilled indicates whether the contour graphs are filled or not Default value is specified in the Contour-DefaultIsFilled ResourceMap key
- vMin, vMaxfloat, optional
Define the interval used to build the color map for the contours If not specified, these values are computed to best fit the graphs. Either specify both values or do not specify any.
Notes
We note
where and
,
with and .In all usages, draw the 1D and 2D cross cuts of
as a function of all input coordinates for 1D cuts
and all couples of coordinates for 2D cuts. Variable coordinates are sampled
regularly using ![ptNb[i]](data:image/svg+xml;base64,PD94bWwgdmVyc2lvbj0nMS4wJyBlbmNvZGluZz0nVVRGLTgnPz4KPCEtLSBUaGlzIGZpbGUgd2FzIGdlbmVyYXRlZCBieSBkdmlzdmdtIDMuNC4yIC0tPgo8c3ZnIHZlcnNpb249JzEuMScgeG1sbnM9J2h0dHA6Ly93d3cudzMub3JnLzIwMDAvc3ZnJyB4bWxuczp4bGluaz0naHR0cDovL3d3dy53My5vcmcvMTk5OS94bGluaycgd2lkdGg9JzM2LjE5ODc3M3B0JyBoZWlnaHQ9JzExLjk1NTE2OHB0JyB2aWV3Qm94PScwIC04Ljk2NjM3NiAzNi4xOTg3NzMgMTEuOTU1MTY4Jz4KPGRlZnM+CjxwYXRoIGlkPSdnMS05MScgZD0nTTIuOTg4NzkyIDIuOTg4NzkyVjIuNTQ2NDUxSDEuODI5MTQxVi04LjUyNDAzNUgyLjk4ODc5MlYtOC45NjYzNzZIMS4zODY4VjIuOTg4NzkySDIuOTg4NzkyWicvPgo8cGF0aCBpZD0nZzEtOTMnIGQ9J00xLjg1MzA1MS04Ljk2NjM3NkguMjUxMDU5Vi04LjUyNDAzNUgxLjQxMDcxVjIuNTQ2NDUxSC4yNTEwNTlWMi45ODg3OTJIMS44NTMwNTFWLTguOTY2Mzc2WicvPgo8cGF0aCBpZD0nZzAtNzgnIGQ9J004Ljg0NjgyNC02LjkxMDA4N0M4Ljk3ODMzMS03LjQyNDE1OSA5LjE2OTYxNC03Ljc4MjgxNCAxMC4wNzgyMDctNy44MTg2OEMxMC4xMTQwNzItNy44MTg2OCAxMC4yNTc1MzQtNy44MzA2MzUgMTAuMjU3NTM0LTguMDMzODczQzEwLjI1NzUzNC04LjE2NTM4IDEwLjE0OTkzOC04LjE2NTM4IDEwLjEwMjExNy04LjE2NTM4QzkuODYzMDE0LTguMTY1MzggOS4yNTMzLTguMTQxNDY5IDkuMDE0MTk3LTguMTQxNDY5SDguNDQwMzQ5QzguMjcyOTc2LTguMTQxNDY5IDguMDU3NzgzLTguMTY1MzggNy44OTA0MTEtOC4xNjUzOEM3LjgxODY4LTguMTY1MzggNy42NzUyMTgtOC4xNjUzOCA3LjY3NTIxOC03LjkzODIzMkM3LjY3NTIxOC03LjgxODY4IDcuNzcwODU5LTcuODE4NjggNy44NTQ1NDUtNy44MTg2OEM4LjU3MTg1Ni03Ljc5NDc3IDguNjE5Njc2LTcuNTE5ODAxIDguNjE5Njc2LTcuMzA0NjA4QzguNjE5Njc2LTcuMTk3MDExIDguNjA3NzIxLTcuMTYxMTQ2IDguNTcxODU2LTYuOTkzNzczTDcuMjIwOTIyLTEuNjAxOTkzTDQuNjYyNTE2LTcuOTYyMTQyQzQuNTc4ODI5LTguMTUzNDI1IDQuNTY2ODc0LTguMTY1MzggNC4zMDM4NjEtOC4xNjUzOEgyLjg0NTMzQzIuNjA2MjI3LTguMTY1MzggMi40OTg2My04LjE2NTM4IDIuNDk4NjMtNy45MzgyMzJDMi40OTg2My03LjgxODY4IDIuNTgyMzE2LTcuODE4NjggMi44MDk0NjUtNy44MTg2OEMyLjg2OTI0LTcuODE4NjggMy41NzQ1OTUtNy44MTg2OCAzLjU3NDU5NS03LjcxMTA4M0MzLjU3NDU5NS03LjY4NzE3MyAzLjU1MDY4NS03LjU5MTUzMiAzLjUzODczLTcuNTU1NjY2TDEuOTQ4NjkyLTEuMjE5NDI3QzEuODA1MjMtLjYzMzYyNCAxLjUxODMwNi0uMzgyNTY1IC43MjkyNjUtLjM0NjdDLjY2OTQ4OS0uMzQ2NyAuNTQ5OTM4LS4zMzQ3NDUgLjU0OTkzOC0uMTE5NTUyQy41NDk5MzggMCAuNjY5NDg5IDAgLjcwNTM1NSAwQy45NDQ0NTggMCAxLjU1NDE3Mi0uMDIzOTEgMS43OTMyNzUtLjAyMzkxSDIuMzY3MTIzQzIuNTM0NDk2LS4wMjM5MSAyLjczNzczMyAwIDIuOTA1MTA2IDBDMi45ODg3OTIgMCAzLjEyMDI5OSAwIDMuMTIwMjk5LS4yMjcxNDhDMy4xMjAyOTktLjMzNDc0NSAzLjAwMDc0Ny0uMzQ2NyAyLjk1MjkyNy0uMzQ2N0MyLjU1ODQwNi0uMzU4NjU1IDIuMTc1ODQxLS40MzAzODYgMi4xNzU4NDEtLjg2MDc3MkMyLjE3NTg0MS0uOTU2NDEzIDIuMTk5NzUxLTEuMDY0MDEgMi4yMjM2NjEtMS4xNTk2NTFMMy44Mzc2MDktNy41NTU2NjZDMy45MDkzNC03LjQzNjExNSAzLjkwOTM0LTcuNDEyMjA0IDMuOTU3MTYxLTcuMzA0NjA4TDYuODAyNDkxLS4yMTUxOTNDNi44NjIyNjctLjA3MTczMSA2Ljg4NjE3NyAwIDYuOTkzNzczIDBDNy4xMTMzMjUgMCA3LjEyNTI4LS4wMzU4NjYgNy4xNzMxMDEtLjIzOTEwM0w4Ljg0NjgyNC02LjkxMDA4N1onLz4KPHBhdGggaWQ9J2cwLTk4JyBkPSdNMi43NjE2NDQtNy45OTgwMDdDMi43NzM1OTktOC4wNDU4MjggMi43OTc1MDktOC4xMTc1NTkgMi43OTc1MDktOC4xNzczMzVDMi43OTc1MDktOC4yOTY4ODcgMi42Nzc5NTgtOC4yOTY4ODcgMi42NTQwNDctOC4yOTY4ODdDMi42NDIwOTItOC4yOTY4ODcgMi4yMTE3MDYtOC4yNjEwMjEgMS45OTY1MTMtOC4yMzcxMTFDMS43OTMyNzUtOC4yMjUxNTYgMS42MTM5NDgtOC4yMDEyNDUgMS4zOTg3NTUtOC4xODkyOUMxLjExMTgzMS04LjE2NTM4IDEuMDI4MTQ0LTguMTUzNDI1IDEuMDI4MTQ0LTcuOTM4MjMyQzEuMDI4MTQ0LTcuODE4NjggMS4xNDc2OTYtNy44MTg2OCAxLjI2NzI0OC03LjgxODY4QzEuODc2OTYxLTcuODE4NjggMS44NzY5NjEtNy43MTEwODMgMS44NzY5NjEtNy41OTE1MzJDMS44NzY5NjEtNy41MDc4NDYgMS43ODEzMi03LjE2MTE0NiAxLjczMzQ5OS02Ljk0NTk1M0wxLjQ0NjU3NS01Ljc5ODI1N0MxLjMyNzAyNC01LjMyMDA1IC42NDU1NzktMi42MDYyMjcgLjU5Nzc1OC0yLjM5MTAzNEMuNTM3OTgzLTIuMDkyMTU0IC41Mzc5ODMtMS44ODg5MTcgLjUzNzk4My0xLjczMzQ5OUMuNTM3OTgzLS41MTQwNzIgMS4yMTk0MjcgLjExOTU1MiAxLjk5NjUxMyAuMTE5NTUyQzMuMzgzMzEzIC4xMTk1NTIgNC44MTc5MzMtMS42NjE3NjggNC44MTc5MzMtMy4zOTUyNjhDNC44MTc5MzMtNC40OTUxNDMgNC4xOTYyNjQtNS4yNzIyMjkgMy4yOTk2MjYtNS4yNzIyMjlDMi42Nzc5NTgtNS4yNzIyMjkgMi4xMTYwNjUtNC43NTgxNTcgMS44ODg5MTctNC41MTkwNTRMMi43NjE2NDQtNy45OTgwMDdaTTIuMDA4NDY4LS4xMTk1NTJDMS42MjU5MDMtLjExOTU1MiAxLjIwNzQ3Mi0uNDA2NDc2IDEuMjA3NDcyLTEuMzM4OTc5QzEuMjA3NDcyLTEuNzMzNDk5IDEuMjQzMzM3LTEuOTYwNjQ4IDEuNDU4NTMxLTIuNzk3NTA5QzEuNDk0Mzk2LTIuOTUyOTI3IDEuNjg1Njc5LTMuNzE4MDU3IDEuNzMzNDk5LTMuODczNDc0QzEuNzU3NDEtMy45NjkxMTYgMi40NjI3NjUtNS4wMzMxMjYgMy4yNzU3MTYtNS4wMzMxMjZDMy44MDE3NDMtNS4wMzMxMjYgNC4wNDA4NDctNC41MDcwOTggNC4wNDA4NDctMy44ODU0M0M0LjA0MDg0Ny0zLjMxMTU4MiAzLjcwNjEwMi0xLjk2MDY0OCAzLjQwNzIyMy0xLjMzODk3OUMzLjEwODM0NC0uNjkzNCAyLjU1ODQwNi0uMTE5NTUyIDIuMDA4NDY4LS4xMTk1NTJaJy8+CjxwYXRoIGlkPSdnMC0xMDUnIGQ9J00zLjM4MzMxMy0xLjcwOTU4OUMzLjM4MzMxMy0xLjc2OTM2NSAzLjMzNTQ5Mi0xLjgxNzE4NiAzLjI2Mzc2MS0xLjgxNzE4NkMzLjE1NjE2NC0xLjgxNzE4NiAzLjE0NDIwOS0xLjc4MTMyIDMuMDg0NDMzLTEuNTc4MDgyQzIuNzczNTk5LS40OTAxNjIgMi4yODM0MzctLjExOTU1MiAxLjg4ODkxNy0uMTE5NTUyQzEuNzQ1NDU1LS4xMTk1NTIgMS41NzgwODItLjE1NTQxNyAxLjU3ODA4Mi0uNTE0MDcyQzEuNTc4MDgyLS44MzY4NjIgMS43MjE1NDQtMS4xOTU1MTcgMS44NTMwNTEtMS41NTQxNzJMMi42ODk5MTMtMy43Nzc4MzNDMi43MjU3NzgtMy44NzM0NzQgMi44MDk0NjUtNC4wODg2NjcgMi44MDk0NjUtNC4zMTU4MTZDMi44MDk0NjUtNC44MTc5MzMgMi40NTA4MDktNS4yNzIyMjkgMS44NjUwMDYtNS4yNzIyMjlDLjc2NTEzMS01LjI3MjIyOSAuMzIyNzktMy41Mzg3MyAuMzIyNzktMy40NDMwODhDLjMyMjc5LTMuMzk1MjY4IC4zNzA2MS0zLjMzNTQ5MiAuNDU0Mjk2LTMuMzM1NDkyQy41NjE4OTMtMy4zMzU0OTIgLjU3Mzg0OC0zLjM4MzMxMyAuNjIxNjY5LTMuNTUwNjg1Qy45MDg1OTMtNC41NTQ5MTkgMS4zNjI4ODktNS4wMzMxMjYgMS44MjkxNDEtNS4wMzMxMjZDMS45MzY3MzctNS4wMzMxMjYgMi4xMzk5NzUtNS4wMjExNzEgMi4xMzk5NzUtNC42Mzg2MDVDMi4xMzk5NzUtNC4zMjc3NzEgMS45ODQ1NTgtMy45MzMyNSAxLjg4ODkxNy0zLjY3MDIzN0wxLjA1MjA1NS0xLjQ0NjU3NUMuOTgwMzI0LTEuMjU1MjkzIC45MDg1OTMtMS4wNjQwMSAuOTA4NTkzLS44NDg4MTdDLjkwODU5My0uMzEwODM0IDEuMjc5MjAzIC4xMTk1NTIgMS44NTMwNTEgLjExOTU1MkMyLjk1MjkyNyAuMTE5NTUyIDMuMzgzMzEzLTEuNjI1OTAzIDMuMzgzMzEzLTEuNzA5NTg5Wk0zLjI4NzY3MS03LjQ2MDAyNUMzLjI4NzY3MS03LjYzOTM1MiAzLjE0NDIwOS03Ljg1NDU0NSAyLjg4MTE5Ni03Ljg1NDU0NUMyLjYwNjIyNy03Ljg1NDU0NSAyLjI5NTM5Mi03LjU5MTUzMiAyLjI5NTM5Mi03LjI4MDY5N0MyLjI5NTM5Mi02Ljk4MTgxOCAyLjU0NjQ1MS02Ljg4NjE3NyAyLjY4OTkxMy02Ljg4NjE3N0MzLjAxMjcwMi02Ljg4NjE3NyAzLjI4NzY3MS03LjE5NzAxMSAzLjI4NzY3MS03LjQ2MDAyNVonLz4KPHBhdGggaWQ9J2cwLTExMicgZD0nTS41MTQwNzIgMS41MTgzMDZDLjQzMDM4NiAxLjg3Njk2MSAuMzgyNTY1IDEuOTcyNjAzLS4xMDc1OTcgMS45NzI2MDNDLS4yNTEwNTkgMS45NzI2MDMtLjM3MDYxIDEuOTcyNjAzLS4zNzA2MSAyLjE5OTc1MUMtLjM3MDYxIDIuMjIzNjYxLS4zNTg2NTUgMi4zMTkzMDMtLjIyNzE0OCAyLjMxOTMwM0MtLjA3MTczMSAyLjMxOTMwMyAuMDk1NjQxIDIuMjk1MzkyIC4yNTEwNTkgMi4yOTUzOTJILjc2NTEzMUMxLjAxNjE4OSAyLjI5NTM5MiAxLjYyNTkwMyAyLjMxOTMwMyAxLjg3Njk2MSAyLjMxOTMwM0MxLjk0ODY5MiAyLjMxOTMwMyAyLjA5MjE1NCAyLjMxOTMwMyAyLjA5MjE1NCAyLjEwNDExQzIuMDkyMTU0IDEuOTcyNjAzIDIuMDA4NDY4IDEuOTcyNjAzIDEuODA1MjMgMS45NzI2MDNDMS4yNTUyOTMgMS45NzI2MDMgMS4yMTk0MjcgMS44ODg5MTcgMS4yMTk0MjcgMS43OTMyNzVDMS4yMTk0MjcgMS42NDk4MTMgMS43NTc0MS0uNDA2NDc2IDEuODI5MTQxLS42ODE0NDVDMS45NjA2NDgtLjM0NjcgMi4yODM0MzcgLjExOTU1MiAyLjkwNTEwNiAuMTE5NTUyQzQuMjU2MDQgLjExOTU1MiA1LjcxNDU3LTEuNjM3ODU4IDUuNzE0NTctMy4zOTUyNjhDNS43MTQ1Ny00LjQ5NTE0MyA1LjA5MjkwMi01LjI3MjIyOSA0LjE5NjI2NC01LjI3MjIyOUMzLjQzMTEzMy01LjI3MjIyOSAyLjc4NTU1NC00LjUzMTAwOSAyLjY1NDA0Ny00LjM2MzYzNkMyLjU1ODQwNi00Ljk2MTM5NSAyLjA5MjE1NC01LjI3MjIyOSAxLjYxMzk0OC01LjI3MjIyOUMxLjI2NzI0OC01LjI3MjIyOSAuOTkyMjc5LTUuMTA0ODU3IC43NjUxMzEtNC42NTA1NkMuNTQ5OTM4LTQuMjIwMTc0IC4zODI1NjUtMy40OTA5MDkgLjM4MjU2NS0zLjQ0MzA4OFMuNDMwMzg2LTMuMzM1NDkyIC41MTQwNzItMy4zMzU0OTJDLjYwOTcxNC0zLjMzNTQ5MiAuNjIxNjY5LTMuMzQ3NDQ3IC42OTM0LTMuNjIyNDE2Qy44NzI3MjctNC4zMjc3NzEgMS4wOTk4NzUtNS4wMzMxMjYgMS41NzgwODItNS4wMzMxMjZDMS44NTMwNTEtNS4wMzMxMjYgMS45NDg2OTItNC44NDE4NDMgMS45NDg2OTItNC40ODMxODhDMS45NDg2OTItNC4xOTYyNjQgMS45MTI4MjctNC4wNzY3MTIgMS44NjUwMDYtMy44NjE1MTlMLjUxNDA3MiAxLjUxODMwNlpNMi41ODIzMTYtMy43MzAwMTJDMi42NjYwMDItNC4wNjQ3NTcgMy4wMDA3NDctNC40MTE0NTcgMy4xOTIwMy00LjU3ODgyOUMzLjMyMzUzNy00LjY5ODM4MSAzLjcxODA1Ny01LjAzMzEyNiA0LjE3MjM1NC01LjAzMzEyNkM0LjY5ODM4MS01LjAzMzEyNiA0LjkzNzQ4NC00LjUwNzA5OCA0LjkzNzQ4NC0zLjg4NTQzQzQuOTM3NDg0LTMuMzExNTgyIDQuNjAyNzQtMS45NjA2NDggNC4zMDM4NjEtMS4zMzg5NzlDNC4wMDQ5ODEtLjY5MzQgMy40NTUwNDQtLjExOTU1MiAyLjkwNTEwNi0uMTE5NTUyQzIuMDkyMTU0LS4xMTk1NTIgMS45NjA2NDgtMS4xNDc2OTYgMS45NjA2NDgtMS4xOTU1MTdDMS45NjA2NDgtMS4yMzEzODIgMS45ODQ1NTgtMS4zMjcwMjQgMS45OTY1MTMtMS4zODY4TDIuNTgyMzE2LTMuNzMwMDEyWicvPgo8cGF0aCBpZD0nZzAtMTE2JyBkPSdNMi40MDI5ODktNC44MDU5NzhIMy41MDI4NjRDMy43MzAwMTItNC44MDU5NzggMy44NDk1NjQtNC44MDU5NzggMy44NDk1NjQtNS4wMjExNzFDMy44NDk1NjQtNS4xNTI2NzcgMy43Nzc4MzMtNS4xNTI2NzcgMy41Mzg3My01LjE1MjY3N0gyLjQ4NjY3NUwyLjkyOTAxNi02Ljg5ODEzMkMyLjk3NjgzNy03LjA2NTUwNCAyLjk3NjgzNy03LjA4OTQxNSAyLjk3NjgzNy03LjE3MzEwMUMyLjk3NjgzNy03LjM2NDM4NCAyLjgyMTQyLTcuNDcxOTggMi42NjYwMDItNy40NzE5OEMyLjU3MDM2MS03LjQ3MTk4IDIuMjk1MzkyLTcuNDM2MTE1IDIuMTk5NzUxLTcuMDUzNTQ5TDEuNzMzNDk5LTUuMTUyNjc3SC42MDk3MTRDLjM3MDYxLTUuMTUyNjc3IC4yNjMwMTQtNS4xNTI2NzcgLjI2MzAxNC00LjkyNTUyOUMuMjYzMDE0LTQuODA1OTc4IC4zNDY3LTQuODA1OTc4IC41NzM4NDgtNC44MDU5NzhIMS42Mzc4NThMLjg0ODgxNy0xLjY0OTgxM0MuNzUzMTc2LTEuMjMxMzgyIC43MTczMS0xLjExMTgzMSAuNzE3MzEtLjk1NjQxM0MuNzE3MzEtLjM5NDUyMSAxLjExMTgzMSAuMTE5NTUyIDEuNzgxMzIgLjExOTU1MkMyLjk4ODc5MiAuMTE5NTUyIDMuNjM0MzcxLTEuNjI1OTAzIDMuNjM0MzcxLTEuNzA5NTg5QzMuNjM0MzcxLTEuNzgxMzIgMy41ODY1NS0xLjgxNzE4NiAzLjUxNDgxOS0xLjgxNzE4NkMzLjQ5MDkwOS0xLjgxNzE4NiAzLjQ0MzA4OC0xLjgxNzE4NiAzLjQxOTE3OC0xLjc2OTM2NUMzLjQwNzIyMy0xLjc1NzQxIDMuMzk1MjY4LTEuNzQ1NDU1IDMuMzExNTgyLTEuNTU0MTcyQzMuMDYwNTIzLS45NTY0MTMgMi41MTA1ODUtLjExOTU1MiAxLjgxNzE4Ni0uMTE5NTUyQzEuNDU4NTMxLS4xMTk1NTIgMS40MzQ2Mi0uNDE4NDMxIDEuNDM0NjItLjY4MTQ0NUMxLjQzNDYyLS42OTM0IDEuNDM0NjItLjkyMDU0OCAxLjQ3MDQ4Ni0xLjA2NDAxTDIuNDAyOTg5LTQuODA1OTc4WicvPgo8L2RlZnM+CjxnIGlkPSdwYWdlMSc+Cjx1c2UgeD0nMCcgeT0nMCcgeGxpbms6aHJlZj0nI2cwLTExMicvPgo8dXNlIHg9JzUuODc1MTQzJyB5PScwJyB4bGluazpocmVmPScjZzAtMTE2Jy8+Cjx1c2UgeD0nMTAuMTAyMzAzJyB5PScwJyB4bGluazpocmVmPScjZzAtNzgnLz4KPHVzZSB4PScyMC43MjQ5MTMnIHk9JzAnIHhsaW5rOmhyZWY9JyNnMC05OCcvPgo8dXNlIHg9JzI1LjcwMjAxOCcgeT0nMCcgeGxpbms6aHJlZj0nI2cxLTkxJy8+Cjx1c2UgeD0nMjguOTUzNjgnIHk9JzAnIHhsaW5rOmhyZWY9JyNnMC0xMDUnLz4KPHVzZSB4PSczMi45NDcxMTInIHk9JzAnIHhsaW5rOmhyZWY9JyNnMS05MycvPgo8L2c+Cjwvc3ZnPgo8IS0tIERFUFRIPTQgLS0+) points in the interval ,
when all the other components of are fixed to the corresponding components
of the centralPoint . In the first usage, vMin and vMax are evaluated as
the min and max of all samples of the function value calculated in all cross cuts performed.
points in the interval ,
when all the other components of are fixed to the corresponding components
of the centralPoint . In the first usage, vMin and vMax are evaluated as
the min and max of all samples of the function value calculated in all cross cuts performed.For 1D cross cuts the graph shows:
for any
where is defined by the equation:For 2D cross cuts:
for any
where
is defined by the equation:Examples
>>> import openturns as ot
>>> from openturns.viewer import View
>>> f = ot.SymbolicFunction(['x0', 'x1', 'x2'], ['sin(1*pi_*x0) + x1 - x2 ^ 2'])
>>> grid = f.drawCrossCuts([0., 0., 0.], [-3., -3, -3], [3, 3, 3], [100, 20, 20], True, True)
>>> View(grid).show()
- getCallsNumber()
Accessor to the number of direct calls to the function.
- Returns:
- calls_numberint
Integer that counts the number of times the function has been called directly through the () operator.
- getClassName()
Accessor to the object’s name.
- Returns:
- class_namestr
The object class name (object.__class__.__name__).
- getDescription()
Accessor to the description of the inputs and outputs.
- Returns:
- description
Description Description of the inputs and the outputs.
- description
Examples
>>> import openturns as ot
>>> f = ot.SymbolicFunction(['x1', 'x2'],
...                         ['2 * x1^2 + x1 + 8 * x2 + 4 * cos(x1) * x2 + 6'])
>>> print(f.getDescription())
[x1,x2,y0]
- getEvaluation()
Accessor to the evaluation function.
- Returns:
- function
EvaluationImplementation The evaluation function.
- function
Examples
>>> import openturns as ot
>>> f = ot.SymbolicFunction(['x1', 'x2'],
...                         ['2 * x1^2 + x1 + 8 * x2 + 4 * cos(x1) * x2 + 6'])
>>> print(f.getEvaluation())
[x1,x2]->[2 * x1^2 + x1 + 8 * x2 + 4 * cos(x1) * x2 + 6]
- getEvaluationCallsNumber()
Accessor to the number of times the evaluation of the function has been called.
- Returns:
- evaluation_calls_numberint
Integer that counts the number of times the evaluation of the function has been called since its creation. This may include indirect calls via finite-difference gradient or Hessian.
- getGradient()
Accessor to the gradient function.
- Returns:
- gradient
GradientImplementation The gradient function.
- gradient
- getGradientCallsNumber()
Accessor to the number of times the gradient of the function has been called.
- Returns:
- gradient_calls_numberint
Integer that counts the number of times the gradient of the Function has been called since its creation. Note that if the gradient is implemented by a finite difference method, the gradient calls number is equal to 0 and the different calls are counted in the evaluation calls number.
- getHessian()
Accessor to the hessian function.
- Returns:
- hessian
HessianImplementation The hessian function.
- hessian
- getHessianCallsNumber()
Accessor to the number of times the hessian of the function has been called.
- Returns:
- hessian_calls_numberint
Integer that counts the number of times the hessian of the Function has been called since its creation. Note that if the hessian is implemented by a finite difference method, the hessian calls number is equal to 0 and the different calls are counted in the evaluation calls number.
- getId()
Accessor to the object’s id.
- Returns:
- idint
Internal unique identifier.
- getImplementation()
Accessor to the underlying implementation.
- Returns:
- implImplementation
A copy of the underlying implementation object.
- getInputDescription()
Accessor to the description of the input vector.
- Returns:
- description
Description Description of the input vector.
- description
Examples
>>> import openturns as ot
>>> f = ot.SymbolicFunction(['x1', 'x2'],
...                          ['2 * x1^2 + x1 + 8 * x2 + 4 * cos(x1) * x2 + 6'])
>>> print(f.getInputDescription())
[x1,x2]
- getInputDimension()
Accessor to the dimension of the input vector.
- Returns:
- inputDimint
Dimension of the input vector
 .
.
Examples
>>> import openturns as ot
>>> f = ot.SymbolicFunction(['x1', 'x2'],
...                          ['2 * x1^2 + x1 + 8 * x2 + 4 * cos(x1) * x2 + 6'])
>>> print(f.getInputDimension())
2
- getMarginal(*args)
Accessor to marginal.
- Parameters:
- indicesint or list of ints
Set of indices for which the marginal is extracted.
- Returns:
- marginal
Function Function corresponding to either
 or
or
 , with
and
, with
and  .
.
- marginal
- getName()
Accessor to the object’s name.
- Returns:
- namestr
The name of the object.
- getOutputDescription()
Accessor to the description of the output vector.
- Returns:
- description
Description Description of the output vector.
- description
Examples
>>> import openturns as ot
>>> f = ot.SymbolicFunction(['x1', 'x2'],
...                          ['2 * x1^2 + x1 + 8 * x2 + 4 * cos(x1) * x2 + 6'])
>>> print(f.getOutputDescription())
[y0]
- getOutputDimension()
Accessor to the number of the outputs.
- Returns:
- number_outputsint
Dimension of the output vector
 .
.
Examples
>>> import openturns as ot
>>> f = ot.SymbolicFunction(['x1', 'x2'],
...                          ['2 * x1^2 + x1 + 8 * x2 + 4 * cos(x1) * x2 + 6'])
>>> print(f.getOutputDimension())
1
- getParameterDescription()
Accessor to the parameter description.
- Returns:
- parameter
Description The parameter description.
- parameter
- getParameterDimension()
Accessor to the dimension of the parameter.
- Returns:
- parameterDimensionint
Dimension of the parameter.
- gradient(inP)
Return the Jacobian transposed matrix of the function at a point.
- Parameters:
- pointsequence of float
Point where the Jacobian transposed matrix is calculated.
- Returns:
- gradient
Matrix The Jacobian transposed matrix of the function at point.
- gradient
Examples
>>> import openturns as ot
>>> f = ot.SymbolicFunction(['x1', 'x2'],
...                ['2 * x1^2 + x1 + 8 * x2 + 4 * cos(x1) * x2 + 6','x1 + x2'])
>>> print(f.gradient([3.14, 4]))
[[ 13.5345   1       ]
 [  4.00001  1       ]]
- hessian(inP)
Return the hessian of the function at a point.
- Parameters:
- pointsequence of float
Point where the hessian of the function is calculated.
- Returns:
- hessian
SymmetricTensor Hessian of the function at point.
- hessian
Examples
>>> import openturns as ot
>>> f = ot.SymbolicFunction(['x1', 'x2'],
...                ['2 * x1^2 + x1 + 8 * x2 + 4 * cos(x1) * x2 + 6','x1 + x2'])
>>> print(f.hessian([3.14, 4]))
sheet #0
[[ 20          -0.00637061 ]
 [ -0.00637061  0          ]]
sheet #1
[[  0           0          ]
 [  0           0          ]]
- isLinear()
Accessor to the linearity of the function.
- Returns:
- linearbool
True if the function is linear, False otherwise.
- isLinearlyDependent(index)
Accessor to the linearity of the function with regard to a specific variable.
- Parameters:
- indexint
The index of the variable with regard to which linearity is evaluated.
- Returns:
- linearbool
True if the function is linearly dependent on the specified variable, False otherwise.
- parameterGradient(inP)
Accessor to the gradient against the parameter.
- Returns:
- gradient
Matrix The gradient.
- gradient
- setDescription(description)
Accessor to the description of the inputs and outputs.
- Parameters:
- descriptionsequence of str
Description of the inputs and the outputs.
Examples
>>> import openturns as ot
>>> f = ot.SymbolicFunction(['x1', 'x2'],
...                          ['2 * x1^2 + x1 + 8 * x2 + 4 * cos(x1) * x2 + 6'])
>>> print(f.getDescription())
[x1,x2,y0]
>>> f.setDescription(['a','b','y'])
>>> print(f.getDescription())
[a,b,y]
- setEvaluation(evaluation)
Accessor to the evaluation function.
- Parameters:
- function
EvaluationImplementation The evaluation function.
- function
- setGradient(gradient)
Accessor to the gradient function.
- Parameters:
- gradient_function
GradientImplementation The gradient function.
- gradient_function
Examples
>>> import openturns as ot
>>> f = ot.SymbolicFunction(['x1', 'x2'],
...                          ['2 * x1^2 + x1 + 8 * x2 + 4 * cos(x1) * x2 + 6'])
>>> f.setGradient(ot.CenteredFiniteDifferenceGradient(
...  ot.ResourceMap.GetAsScalar('CenteredFiniteDifferenceGradient-DefaultEpsilon'),
...  f.getEvaluation()))
- setHessian(hessian)
Accessor to the hessian function.
- Parameters:
- hessian_function
HessianImplementation The hessian function.
- hessian_function
Examples
>>> import openturns as ot
>>> f = ot.SymbolicFunction(['x1', 'x2'],
...                         ['2 * x1^2 + x1 + 8 * x2 + 4 * cos(x1) * x2 + 6'])
>>> f.setHessian(ot.CenteredFiniteDifferenceHessian(
...  ot.ResourceMap.GetAsScalar('CenteredFiniteDifferenceHessian-DefaultEpsilon'),
...  f.getEvaluation()))
- setInputDescription(inputDescription)
Accessor to the description of the input vector.
- Parameters:
- description
Description Description of the input vector.
- description
- setName(name)
Accessor to the object’s name.
- Parameters:
- namestr
The name of the object.
- setOutputDescription(inputDescription)
Accessor to the description of the output vector.
- Parameters:
- description
Description Description of the output vector.
- description
- setParameter(parameter)
Accessor to the parameter values.
- Parameters:
- parametersequence of float
The parameter values.
- setParameterDescription(description)
Accessor to the parameter description.
- Parameters:
- parameter
Description The parameter description.
- parameter
- setStopCallback(callBack, state=None)
Set up a stop callback.
Can be used to programmatically stop an evaluation.
- Parameters:
- callbackcallable
Returns a bool deciding whether to stop or continue.
Examples using the class
Create your own distribution given its quantile function
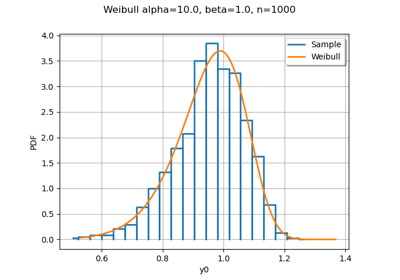
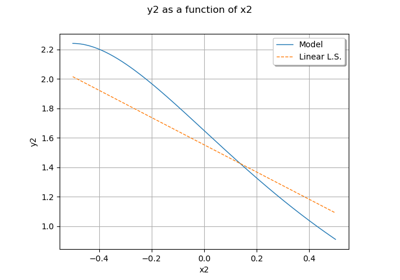
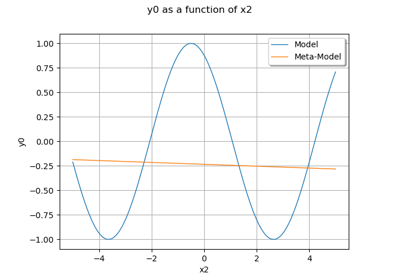
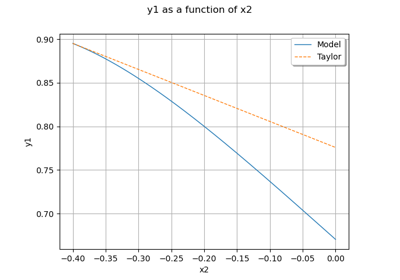

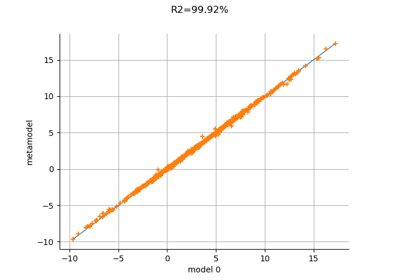
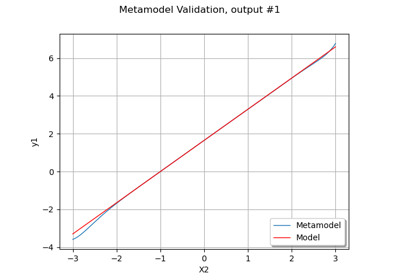
Create a polynomial chaos metamodel from a data set
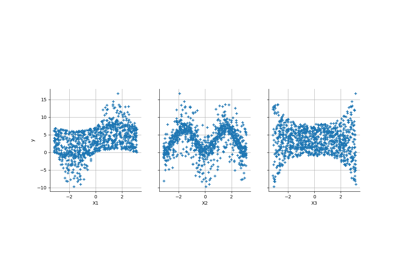
Create a polynomial chaos for the Ishigami function: a quick start guide to polynomial chaos
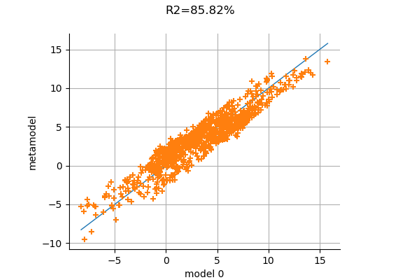
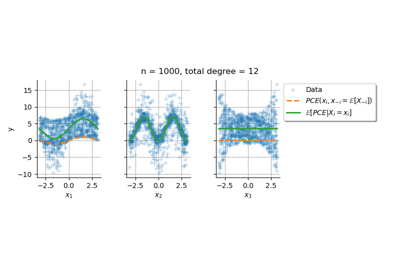
Conditional expectation of a polynomial chaos expansion
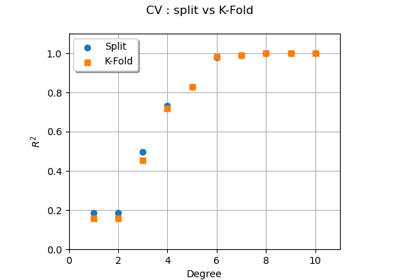
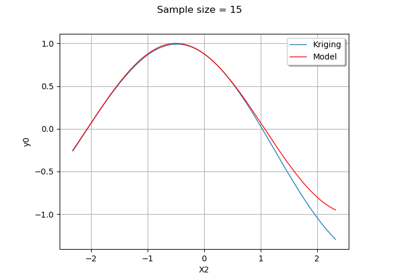
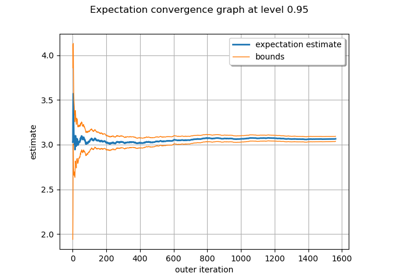
Evaluate the mean of a random vector by simulations
Using the FORM - SORM algorithms on a nonlinear function
Sobol’ sensitivity indices using rank-based algorithm

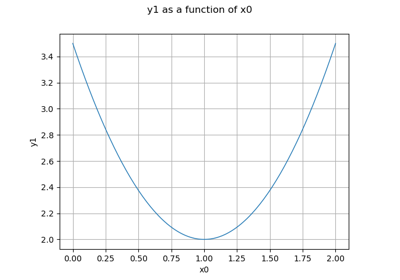

Calibrate a parametric model: a quick-start guide to calibration
Generate observations of the Chaboche mechanical model
Compute leave-one-out error of a polynomial chaos expansion