Description
- class Description(*args)
Collection of strings.
- Available constructors:
Description(size=0, value=’ ‘)
Description(sequence)
- Parameters:
- sizeint,
Size of the collection.
- valuestr
Value set to the size elements.
- sequencesequence of str
Components of the vector.
- sizeint,
Examples
>>> import openturns as ot
Use the first constructor:
>>> ot.Description()
[]
>>> ot.Description(2)
[,]
>>> ot.Description(2, 'C')
[C,C]
Use the second constructor:
>>> vector = ot.Description(['P1', 'P2', 'P3'])
>>> vector
[P1,P2,P3]
Use some functionalities:
>>> vector[1] = 'P4'
>>> vector
[P1,P4,P3]
>>> vector.add('P5')
>>> vector
[P1,P4,P3,P5]
Methods
BuildDefault(*args)Build a default description.
add(*args)Append a component (in-place).
at(*args)Access to an element of the collection.
clear()Reset the collection to zero dimension.
find(val)Find the index of a given value.
Accessor to the object's name.
getId()Accessor to the object's id.
getName()Accessor to the object's name.
Accessor to the object's shadowed id.
getSize()Get the collection's dimension (or size).
Accessor to the object's visibility state.
hasName()Test if the object is named.
Test if the object has a distinguishable name.
isBlank()Check if the description is blank.
isEmpty()Tell if the collection is empty.
resize(newSize)Change the size of the collection.
select(marginalIndices)Selection from indices.
setName(name)Accessor to the object's name.
setShadowedId(id)Accessor to the object's shadowed id.
setVisibility(visible)Accessor to the object's visibility state.
sort
- __init__(*args)
- static BuildDefault(*args)
Build a default description.
- Parameters:
- sizeint,
Size of the collection.
- valuestr
Prefixed label of the final labels. By default, it is equal to Component.
- sizeint,
- Returns:
- description
Description Description of dimension size built as: value0, …, valueN with N=size-1.
- description
Examples
>>> import openturns as ot
>>> ot.Description.BuildDefault(3)
[Component0,Component1,Component2]
>>> ot.Description.BuildDefault(3, 'C')
[C0,C1,C2]
- add(*args)
Append a component (in-place).
- Parameters:
- valuetype depends on the type of the collection.
The component to append.
Examples
>>> import openturns as ot
>>> x = ot.Point(2)
>>> x.add(1.)
>>> print(x)
[0,0,1]
- at(*args)
Access to an element of the collection.
- Parameters:
- indexpositive int
Position of the element to access.
- Returns:
- elementtype depends on the type of the collection
Element of the collection at the position index.
- clear()
Reset the collection to zero dimension.
Examples
>>> import openturns as ot
>>> x = ot.Point(2)
>>> x.clear()
>>> x
class=Point name=Unnamed dimension=0 values=[]
- find(val)
Find the index of a given value.
- Parameters:
- valcollection value type
The value to find
- Returns:
- indexint
The index of the first occurrence of the value, or the size of the container if not found. When several values match, only the first index is returned.
- getClassName()
Accessor to the object’s name.
- Returns:
- class_namestr
The object class name (object.__class__.__name__).
- getId()
Accessor to the object’s id.
- Returns:
- idint
Internal unique identifier.
- getName()
Accessor to the object’s name.
- Returns:
- namestr
The name of the object.
- getShadowedId()
Accessor to the object’s shadowed id.
- Returns:
- idint
Internal unique identifier.
- getSize()
Get the collection’s dimension (or size).
- Returns:
- nint
The number of components in the collection.
- getVisibility()
Accessor to the object’s visibility state.
- Returns:
- visiblebool
Visibility flag.
- hasName()
Test if the object is named.
- Returns:
- hasNamebool
True if the name is not empty.
- hasVisibleName()
Test if the object has a distinguishable name.
- Returns:
- hasVisibleNamebool
True if the name is not empty and not the default one.
- isBlank()
Check if the description is blank.
- Returns:
- isBlankbool
True if all the components are empty.
Examples
>>> import openturns as ot
>>> vector = ot.Description(3)
>>> vector.isBlank()
True
>>> vector = ot.Description(['P1', 'P2', ' '])
>>> vector.isBlank()
False
- isEmpty()
Tell if the collection is empty.
- Returns:
- isEmptybool
True if there is no element in the collection.
Examples
>>> import openturns as ot
>>> x = ot.Point(2)
>>> x.isEmpty()
False
>>> x.clear()
>>> x.isEmpty()
True
- resize(newSize)
Change the size of the collection.
- Parameters:
- newSizepositive int
New size of the collection.
Notes
If the new size is smaller than the older one, the last elements are thrown away, else the new elements are set to the default value of the element type.
Examples
>>> import openturns as ot
>>> x = ot.Point(2, 4)
>>> print(x)
[4,4]
>>> x.resize(1)
>>> print(x)
[4]
>>> x.resize(4)
>>> print(x)
[4,0,0,0]
- select(marginalIndices)
Selection from indices.
- Parameters:
- indicessequence of int
Indices to select
- Returns:
- collsequence
Sub-collection of values at the selection indices.
- setName(name)
Accessor to the object’s name.
- Parameters:
- namestr
The name of the object.
- setShadowedId(id)
Accessor to the object’s shadowed id.
- Parameters:
- idint
Internal unique identifier.
- setVisibility(visible)
Accessor to the object’s visibility state.
- Parameters:
- visiblebool
Visibility flag.
Examples using the class
Create a polynomial chaos for the Ishigami function: a quick start guide to polynomial chaos
Non parametric Adaptive Importance Sampling (NAIS)
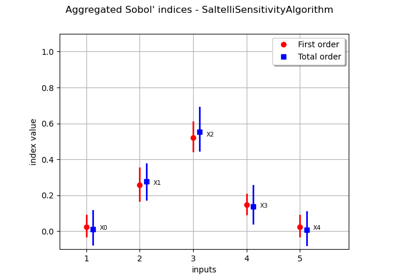
Estimate Sobol’ indices for a function with multivariate output
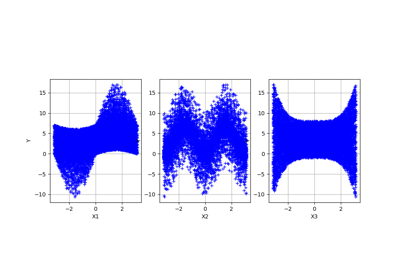
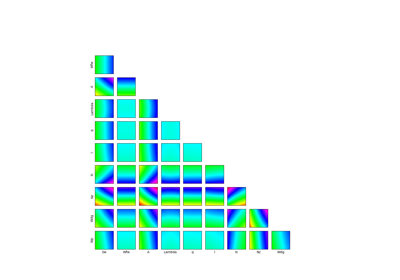
Example of sensitivity analyses on the wing weight model
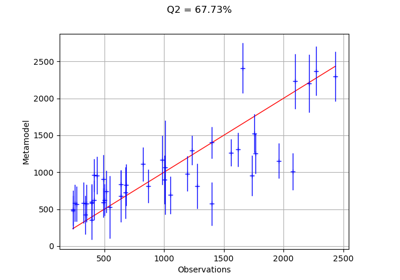
Compute confidence intervals of a regression model from data
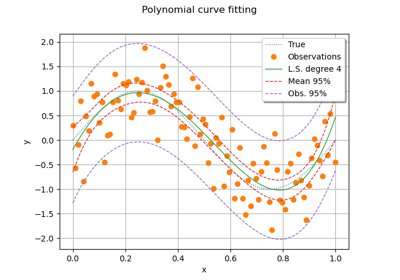
Compute confidence intervals of a univariate noisy function
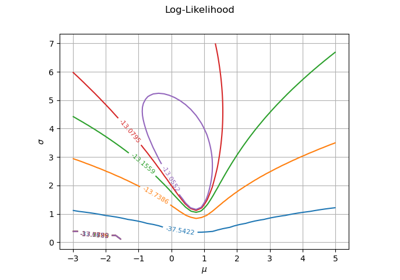
Plot the log-likelihood contours of a distribution
 OpenTURNS
