Graph
- class Graph(*args)
Class Graph containing drawable elements and a graphical context.
- Available constructors:
Graph(title=’’)
Graph(title, xTitle, yTitle, showAxes, legendPosition=’’, legendFontSize=1.0, logScale=ot.GraphImplementation.NONE)
- Parameters:
- titlestr
Title of the graph.
- xTitlestr
Legend of the X axe.
- yTitlestr
Legend of the Y axe.
- showAxesbool
True to draw the axes. False to hide them.
- legendPositionstr
Indication of the legend’s position. If legendPosition is not specified, the Graph has no legend. The valid strings are given by the
GetValidLegendPositions()method.- legendFontSizefloat
Font size of the legend.
- logScaleint
logScale indicates whether the logarithmic scale is used either for one or both axes:
ot.GraphImplementation.NONE or 0: no log scale is used,
ot.GraphImplementation.LOGX or 1: log scale is used only for horizontal data,
ot.GraphImplementation.LOGY or 2: log scale is used only for vertical data,
ot.GraphImplementation.LOGXY or 3: log scale is used for both data.
Methods
Accessor to the list of valid legend positions.
IsValidLegendPosition(position)Test if the proposed legend position is valid or not.
add(*args)Add drawable instances to the collection of drawables contained in Graph.
erase(i)Erase a drawable instance from the collection of drawables contained in Graph.
Accessor to the indication of automatic bounding box.
getAxes()Accessor to the indication of axes' presence on the Graph.
Accessor to the bounding box of the whole plot.
Accessor to the object's name.
Accessor to the colors of the Drawables included in the Graph.
getDrawable(index)Accessor to a Drawable included in the Graph.
Accessor to the Drawables included in the Graph.
getGrid()Accessor to the indication of grid's presence on the Graph.
Accessor to the indication of grid's color on the Graph.
getId()Accessor to the object's id.
Accessor to the underlying implementation.
Accessor to the integer x-axis ticks flag.
Accessor to the integer y-axis ticks flag.
Accessor to the legends' font size of the Drawables inside the Graph.
Accessor to the legend's position of the Drawables inside the Graph.
Accessor to the legends of the Drawables inside the Graph.
Accessor to the indication of axes' scale of the Graph.
getName()Accessor to the object's name.
Accessor to the ticks location flag.
getTitle()Accessor to the title of the Graph.
Accessor to the title of the X axe.
Accessor to the title of the Y axe.
setAutomaticBoundingBox(automaticBoundingBox)Accessor to the indication of automatic bounding box.
setAxes(showAxes)Accessor to the indication of axes' presence on the Graph.
setBoundingBox(boundingBox)Accessor to the bounding box of the whole plot.
setColors(colors)Update the colors of the Drawables inside the Graph.
Assign colors to a default palette to all the drawables of the Graph.
setDrawable(drawable, index)Accessor to a Drawable included in the Graph.
setDrawables(drawableCollection)Accessor to the Drawables included in the Graph.
setGrid(showGrid)Hide or shows grid of the Graph.
setGridColor(color)Accessor to the indication of grid's color on the Graph.
setIntegerXTick(integerXTick)Accessor to the integer x-axis ticks flag.
setIntegerYTick(integerYTick)Accessor to the integer y-axis ticks flag.
setLegendFontSize(legendFontSize)Accessor to the legend's font size of the Drawables inside the Graph.
setLegendPosition(position)Accessor to the legend's position of the Drawables inside the Graph.
setLegends(legends)Accessor to the legends of the Drawables inside the Graph.
setLogScale(logScale)Accessor to the indication of axes' scale of the Graph.
setName(name)Accessor to the object's name.
setTickLocation(tickLocation)Accessor to the ticks location flag.
setTitle(title)Accessor to the title of the Graph.
setXMargin(xMargin)Accessor to the horizontal margin size.
setXTitle(title)Accessor to the title of the X axe.
setYMargin(yMargin)Accessor to the vertical margin size.
setYTitle(title)Accessor to the title of the Y axe.
clean
draw
getRCommand
- __init__(*args)
- static GetValidLegendPositions()
Accessor to the list of valid legend positions.
- Returns:
- listPositions
Description All the valid legend positions.
- listPositions
Examples
>>> import openturns as ot
>>> print(ot.Graph.GetValidLegendPositions())
[,bottomright,bottom,bottomleft,left,topleft,top,topright,right,center]#10
- static IsValidLegendPosition(position)
Test if the proposed legend position is valid or not.
- Parameters:
- positionstr
Proposed legend position of the Drawables inside the Graph.
- Returns:
- validitybool
True if the proposed legend position is valid, False if it is not.
See also
Examples
>>> import openturns as ot
>>> print(ot.Graph.IsValidLegendPosition('lefttop'))
False
>>> print(ot.Graph.IsValidLegendPosition('topleft'))
True
- add(*args)
Add drawable instances to the collection of drawables contained in Graph.
- Available usages:
add(drawables)
add(aGraph)
- Parameters:
Notes
It adds the new drawables or graph inside the first one, with their legend. It keeps the graphical context of the first graph. Each drawable keeps its graphical context.
Warning
Different drawables might be colored the same…
- erase(i)
Erase a drawable instance from the collection of drawables contained in Graph.
- Parameters:
- indexint
Index of the drawable instance to erase from the collection of drawables contained in Graph.
- getAutomaticBoundingBox()
Accessor to the indication of automatic bounding box.
- Returns:
- autoBoundingBoxbool
Indicates if the bounding box is automatically created or not. The bounding box of the drawable element is a rectangle determined by its range along X and its range along Y.
- getAxes()
Accessor to the indication of axes’ presence on the Graph.
- Returns:
- axesbool
True if the axes are drawn, False if they are hidden.
- getBoundingBox()
Accessor to the bounding box of the whole plot.
- Returns:
- boundingBox
Intervalof dimension 2 Bounding box of the drawable element, which is a rectangle determined by its range along X and its range along Y. This methods adds x/y margins according to the margin attributes.
- boundingBox
- getClassName()
Accessor to the object’s name.
- Returns:
- class_namestr
The object class name (object.__class__.__name__).
- getColors()
Accessor to the colors of the Drawables included in the Graph.
- Returns:
- listColors
Description List of all the colors used for the Drawables contained inside the graph.
- listColors
- getDrawable(index)
Accessor to a Drawable included in the Graph.
- Parameters:
- indexpositive int
Position of the Drawable.
- Returns:
- drawable
Drawable Drawable included in the Graph at the index.
- drawable
- getDrawables()
Accessor to the Drawables included in the Graph.
- Returns:
- drawableslist of
Drawable Drawables included in the Graph.
- drawableslist of
- getGrid()
Accessor to the indication of grid’s presence on the Graph.
- Returns:
- showGridbool
True to show the grid of the Graph, False to hide it. By default there is a gray grid.
- getGridColor()
Accessor to the indication of grid’s color on the Graph.
- Returns:
- gridColorstr
Color of the grid. By default the grid is gray.
- getId()
Accessor to the object’s id.
- Returns:
- idint
Internal unique identifier.
- getImplementation()
Accessor to the underlying implementation.
- Returns:
- implImplementation
A copy of the underlying implementation object.
- getIntegerXTick()
Accessor to the integer x-axis ticks flag.
- Returns:
- integerXTickbool
Whether to draw only integer ticks on the x-axis.
- getIntegerYTick()
Accessor to the integer y-axis ticks flag.
- Returns:
- integerYTickbool
Whether to draw only integer ticks on the y-axis.
- getLegendFontSize()
Accessor to the legends’ font size of the Drawables inside the Graph.
- Returns:
- fontSizefloat
Legends’ font size used for the drawables contained inside the Graph.
See also
- getLegendPosition()
Accessor to the legend’s position of the Drawables inside the Graph.
- Returns:
- positionstr
Legend’s position used for the drawables contained inside the Graph.
See also
- getLegends()
Accessor to the legends of the Drawables inside the Graph.
- Returns:
- legends
Description Legends used for the drawables contained inside the Graph.
- legends
- getLogScale()
Accessor to the indication of axes’ scale of the Graph.
- Returns:
- scaleint
Indicates the type of the axes’s scale:
0: no log scale is used,
1: log scale is used only for horizontal data,
2: log scale is used only for vertical data,
3: log scale is used for both data.
- getName()
Accessor to the object’s name.
- Returns:
- namestr
The name of the object.
- getTickLocation()
Accessor to the ticks location flag.
- Returns:
- locint
Indicates the ticks location.
- getTitle()
Accessor to the title of the Graph.
- Returns:
- titlestr
Title of the Graph.
- getXTitle()
Accessor to the title of the X axe.
- Returns:
- Xtitlestr
Title of the X axe.
- getYTitle()
Accessor to the title of the Y axe.
- Returns:
- Ytitlestr
Title of the Y axe.
- setAutomaticBoundingBox(automaticBoundingBox)
Accessor to the indication of automatic bounding box.
- Parameters:
- autoBoundingBoxbool
Indicates if the bounding box is automatically created or not. The bounding box of the drawable element is a rectangle determined by its range along X and its range along Y.
- setAxes(showAxes)
Accessor to the indication of axes’ presence on the Graph.
- Parameters:
- axesbool
True to draw the axes, False to hide the axes.
- setBoundingBox(boundingBox)
Accessor to the bounding box of the whole plot.
- Parameters:
- boundingBox
Intervalof dimension 2 Bounding box of the drawable element, which is a rectangle determined by its range along X and its range along Y.
- boundingBox
- setColors(colors)
Update the colors of the Drawables inside the Graph.
- Parameters:
- listColorssequence of str
List of the colors used for each Drawable of the Graph. If the listColors’s size is lower than the number of Drawables, the first colors of listColors are re-used. If it is greated than the number of Drawables, the last colors of the list are ignored.
The listColors argument can be the result of the static method
BuildDefaultPalette()orBuildTableauPalette()of the Drawable object.
- setDefaultColors()
Assign colors to a default palette to all the drawables of the Graph.
Notes
This method ensures that drawables of the Graph have different colors.
- setDrawable(drawable, index)
Accessor to a Drawable included in the Graph.
- Parameters:
- drawable
Drawable Drawable included in the Graph.
- indexint
Position of the Drawable.
- drawable
- setDrawables(drawableCollection)
Accessor to the Drawables included in the Graph.
- Parameters:
- drawableslist of
Drawable Drawables included in the Graph.
- drawableslist of
- setGrid(showGrid)
Hide or shows grid of the Graph.
- Parameters:
- showGridbool
True to show the grid of the Graph, False to hide it.
- setGridColor(color)
Accessor to the indication of grid’s color on the Graph.
- Parameters:
- gridColorstr
Color of the grid. By default the grid is gray.
- setIntegerXTick(integerXTick)
Accessor to the integer x-axis ticks flag.
- Parameters:
- integerXTickbool
Whether to draw only integer ticks on the x-axis.
- setIntegerYTick(integerYTick)
Accessor to the integer y-axis ticks flag.
- Parameters:
- integerYTickbool
Whether to draw only integer ticks on the y-axis.
- setLegendFontSize(legendFontSize)
Accessor to the legend’s font size of the Drawables inside the Graph.
- Parameters:
- fontSizefloat
Legend’s font size used for the drawables contained inside the Graph.
Examples
>>> import openturns as ot
>>> fontSize = 1.0
>>> # Create an empty graph
>>> myGraph = ot.Graph('Some curves', 'x1', 'x2', True, 'topright', fontSize, 0)
>>> myGraph.setLegendFontSize(1.5)
>>> print(myGraph.getLegendFontSize())
1.5
- setLegendPosition(position)
Accessor to the legend’s position of the Drawables inside the Graph.
- Parameters:
- positionstr
Legend’s position used for the drawables contained inside the Graph. The valid positions are given by the method
GetValidLegendPositions().
Examples
>>> import openturns as ot
>>> position = 'topright'
>>> # Create an empty graph
>>> myGraph = ot.Graph('Some curves', 'x1', 'x2', True, position, 1.0, 0)
>>> myGraph.setLegendPosition('bottomleft')
>>> print(myGraph.getLegendPosition())
bottomleft
- setLegends(legends)
Accessor to the legends of the Drawables inside the Graph.
- Parameters:
- legendssequence of str
Legends used for the drawables contained inside the Graph.
- setLogScale(logScale)
Accessor to the indication of axes’ scale of the Graph.
- Parameters:
- scaleint
Indicates the type of the axes’s scale:
ot.GraphImplementation.NONE or 0: no log scale is used,
ot.GraphImplementation.LOGX or 1: log scale is used only for horizontal data,
ot.GraphImplementation.LOGY or 2: log scale is used only for vertical data,
ot.GraphImplementation.LOGXY or 3: log scale is used for both data.
- setName(name)
Accessor to the object’s name.
- Parameters:
- namestr
The name of the object.
- setTickLocation(tickLocation)
Accessor to the ticks location flag.
- Parameters:
- locint
Indicates the ticks location:
ot.GraphImplementation.TICKNONE: no ticks,
ot.GraphImplementation.TICKX: horizontal ticks,
ot.GraphImplementation.TICKY: vertical ticks,
ot.GraphImplementation.TICKXY: horizontal and vertical ticks.
- setTitle(title)
Accessor to the title of the Graph.
- Parameters:
- titlestr
Title of the Graph.
- setXMargin(xMargin)
Accessor to the horizontal margin size.
- Parameters:
- xMarginfloat
Horizontal margin ratio, defaults to 5% of the range on each side. In log-scale, it is interpreted as a power of 10; setting a value of 1 means a margin of one decade on each side. Defaults to Graph-DefaultHorizontalMargin map value.
- setXTitle(title)
Accessor to the title of the X axe.
- Parameters:
- Xtitlestr
Title of the X axe.
- setYMargin(yMargin)
Accessor to the vertical margin size.
- Parameters:
- yMarginfloat
Vertical margin ratio, defaults to 5% of the range on each side. In log-scale, it is interpreted as a power of 10; setting a value of 1 means a margin of one decade on each side. Defaults to Graph-DefaultVerticalMargin map value.
- setYTitle(title)
Accessor to the title of the Y axe.
- Parameters:
- Ytitlestr
Title of the Y axe.
Examples using the class


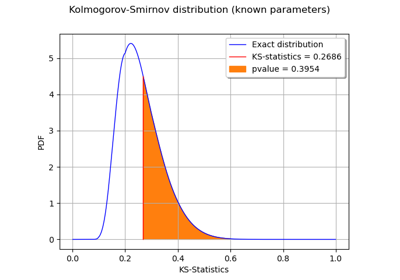
Kolmogorov-Smirnov : get the statistics distribution


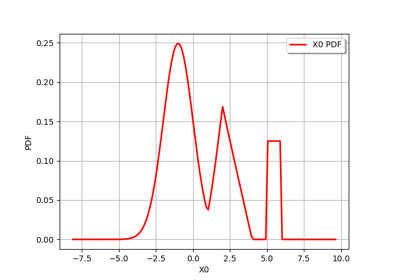
Create the distribution of the maximum of independent distributions
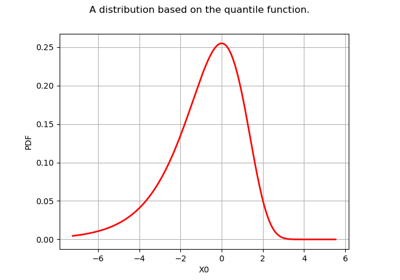
Create your own distribution given its quantile function


Create a gaussian process from a cov. model using HMatrix


Create a process from random vectors and processes
Sample trajectories from a Gaussian Process with correlated outputs


Create a polynomial chaos for the Ishigami function: a quick start guide to polynomial chaos

Example of multi output Kriging on the fire satellite model
Evaluate the mean of a random vector by simulations


Estimate a probability with Monte-Carlo on axial stressed beam: a quick start guide to reliability
Use the FORM algorithm in case of several design points
Non parametric Adaptive Importance Sampling (NAIS)

Axial stressed beam : comparing different methods to estimate a probability
An illustrated example of a FORM probability estimate
Estimate Sobol indices on a field to point function

Estimate Sobol’ indices for a function with multivariate output
Example of sensitivity analyses on the wing weight model


Create mixed deterministic and probabilistic designs of experiments
Create a design of experiments with discrete and continuous variables


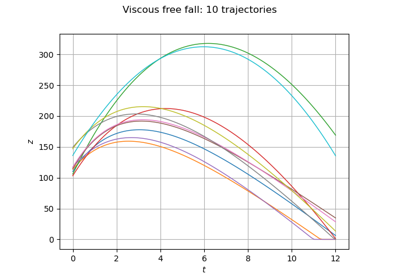
Define a function with a field output: the viscous free fall example


Linear Regression with interval-censored observations


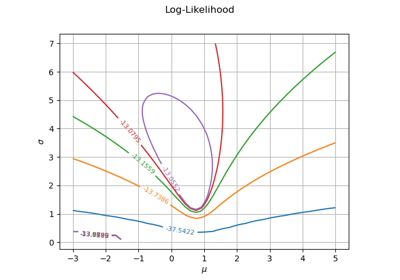
Plot the log-likelihood contours of a distribution
